


 279 / 762

Chapter 7: Probability
279
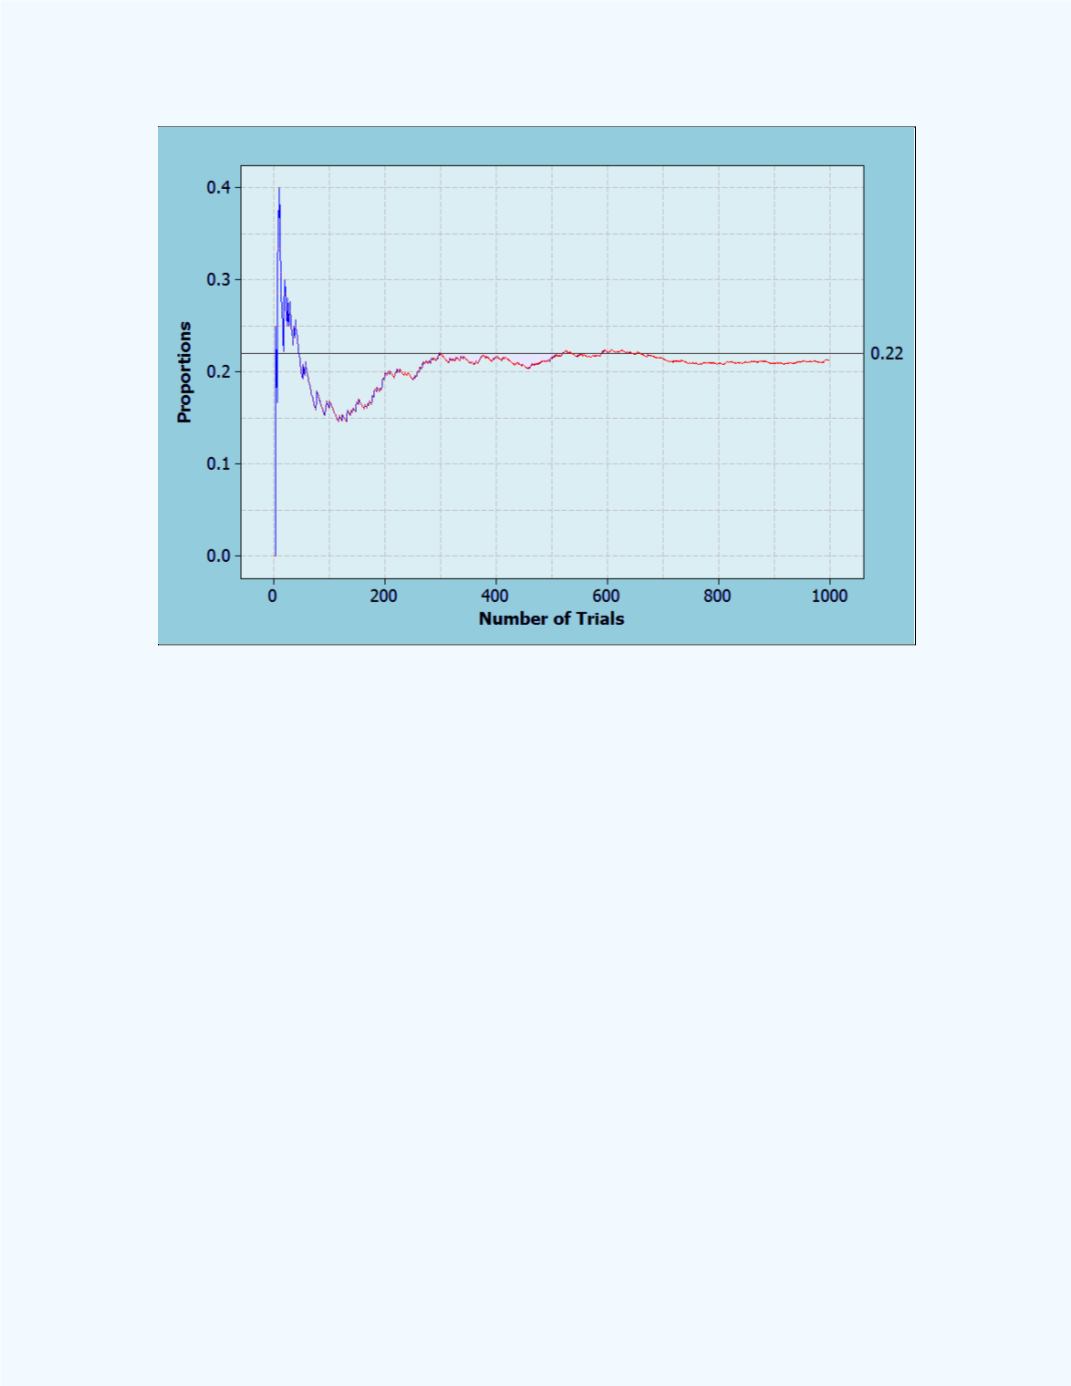
Figure 7-5:
Display of simulation for 1000 trials
The display in
Figure 7-5
shows the simulation for 1,000 trials. Observe
some convergence of the cumulative relative frequencies to a value of 0.22.
This can be expected, since the number of trials is increased to 1,000.
Figure 7-6
shows what is happening as the number of trials gets very large.
The proportion gets closer to the 0.22 mark, which is the theoretical
probability of observing a student with strep throat.