


 392 / 762

392
Chapter 9: The Normal Probability Distribution
Figure 9-32:
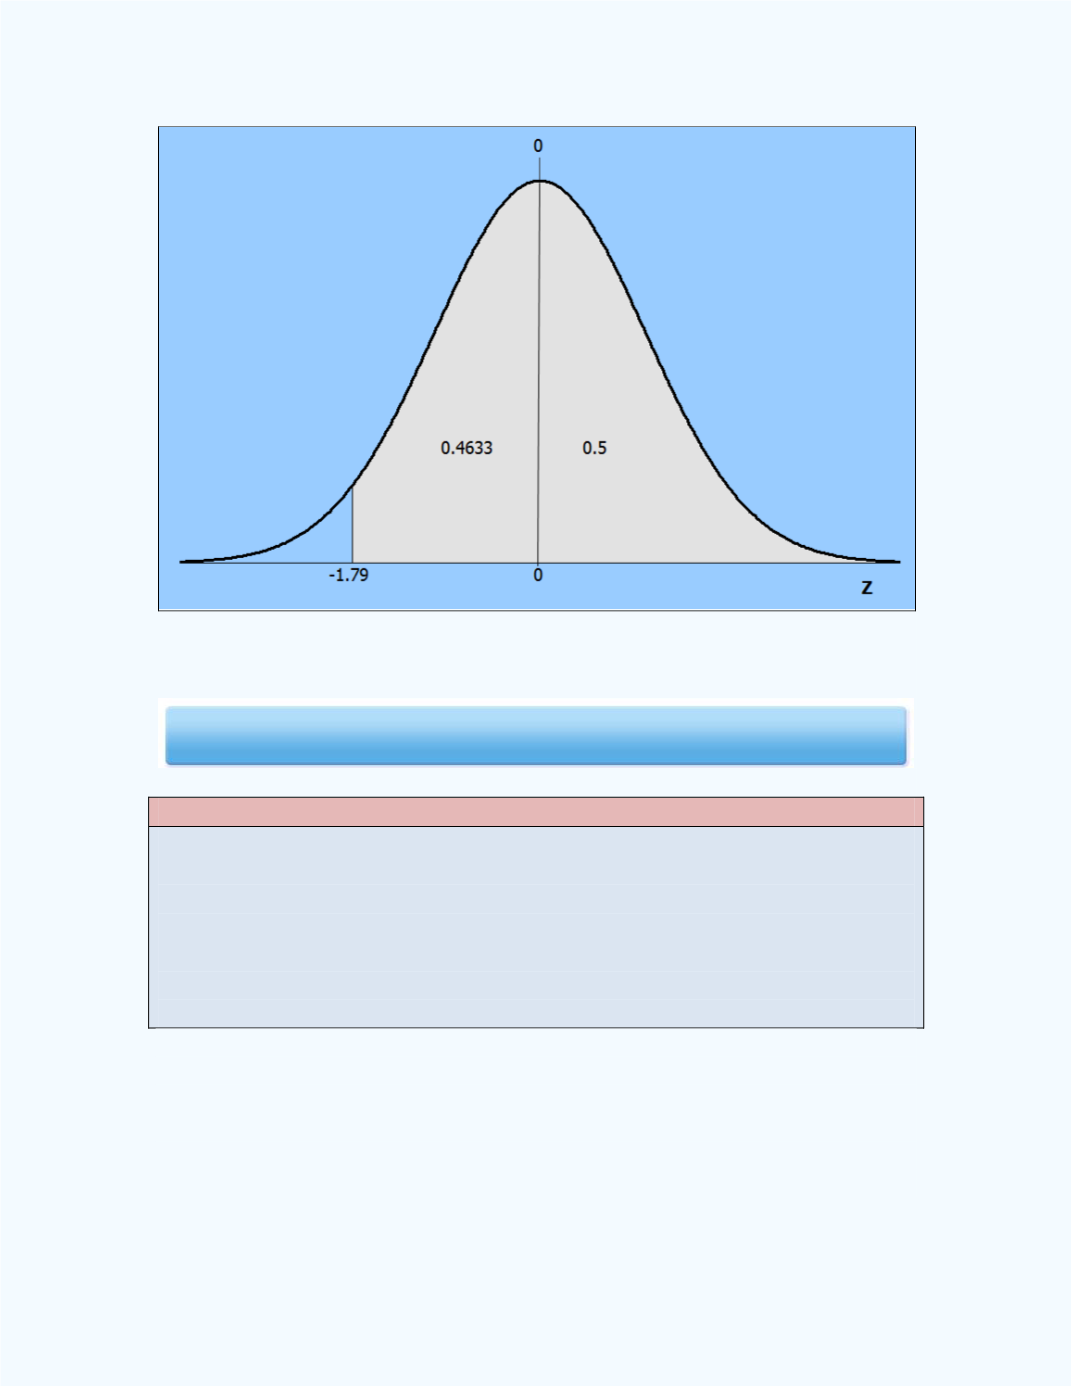
Area for
P
(z
-1.79)
Notes:
Other problems can be illustrated which may involve any combination
of the above situations.
The normal distribution workbook can solve ANY z-value. Thus this
workbook is much more versatile than the z-tables since the z-tables
work only for the specified z-values listed in the tables.
The following example illustrates for the second note given above.
Example 9-9:
Find the area under the standard normal distribution curve
between -1.1234 and 2.0932.
Click here for the z-Table Workbook