


 476 / 762

476
Chapter 11: Confidence Intervals – Large Samples
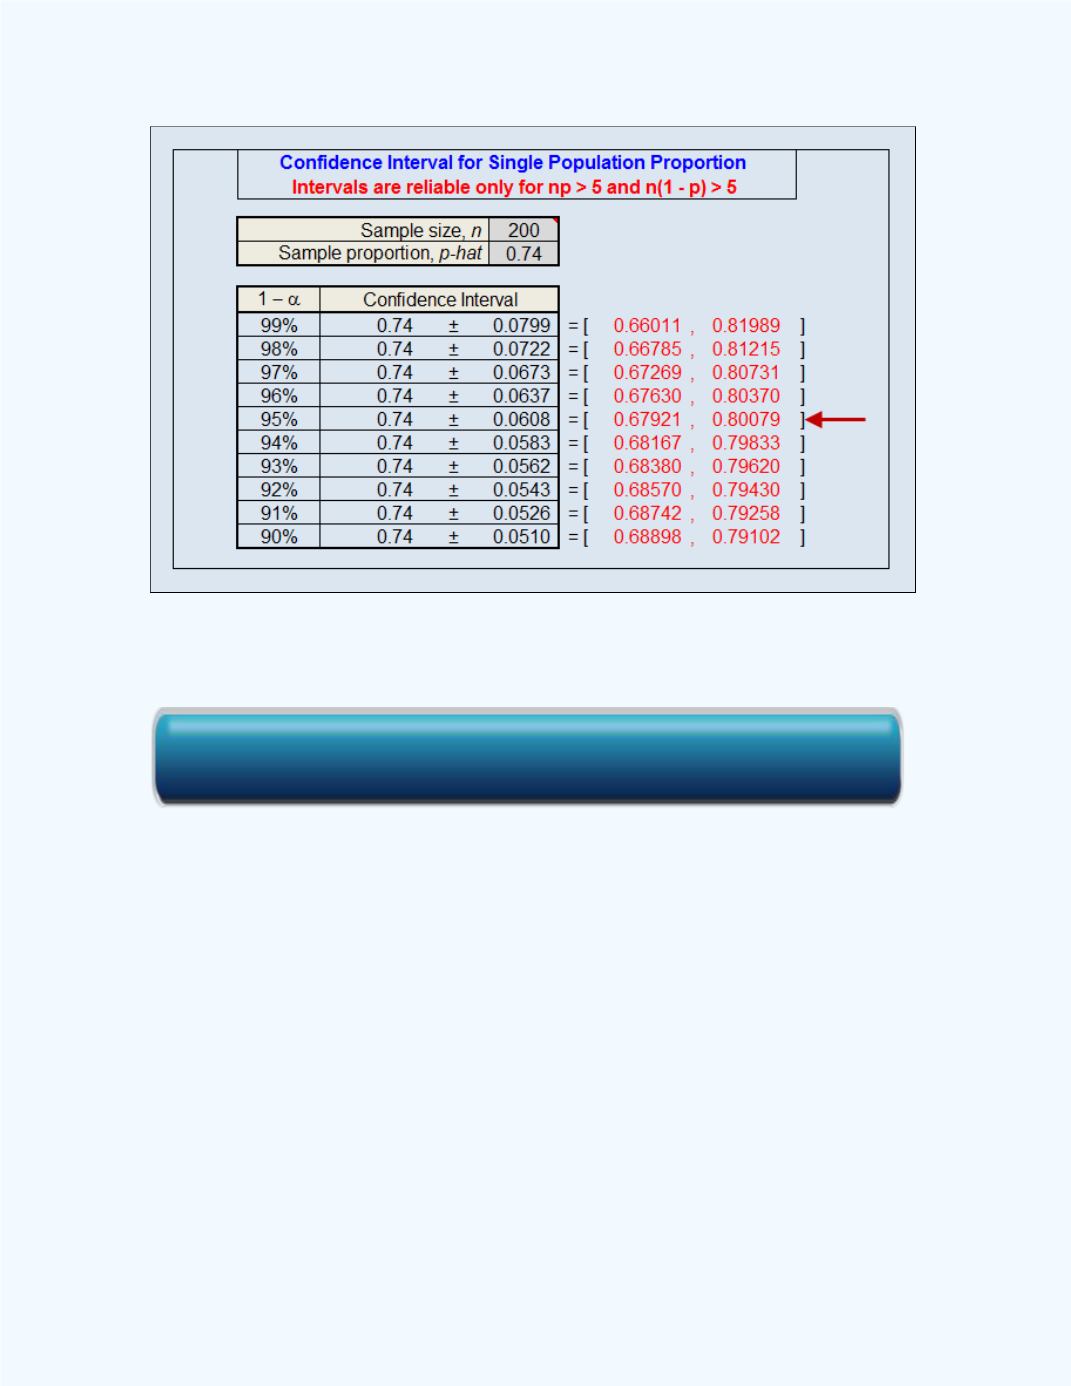
Figure 11-6:
Workbook Output with the Confidence
Interval for
Example 11-3
Repeated Sample Interpretation of a Confidence interval
In
Example 11-3
, 74% of the sample of 200 said that they do not consult a
consumer ratings publication such as Consumer Reports when they purchase
a new car. If another sample of size 200 is taken, it is unlikely that the
sample proportion will again be 74%. Thus, in repeated sampling, we should
not expect the sample proportions to all be the same. If we use these sample
proportions to construct 95% confidence intervals, we should expect most, if
not all, to be different. However, we should expect 95 percent of them to
contain the true proportion of people who, when they purchase a new vehicle
do not consult a consumer ratings publication, such as Consumer Reports.
This is the reason why we say that we are 95 percent confident that the
population proportion will lie between 0.6792 and 0.8008, in the example.
Click here for the Large Sample Confidence Interval for a Single Population Proportion Workbook