


 472 / 762

472
Chapter 11: Confidence Intervals – Large Samples
We can use the
Inverse Normal Distribution
workbook to compute any
values. Note if we need to compute
⁄
, you will first find the value for
and then enter this value in the area cells in workbook to determine the
value. These
values are denoted by
x
in the workbook.
You will have to
use a mean of 0 and a standard deviation of 1 in order to compute the
values since the
-values will follow a standard normal distribution.
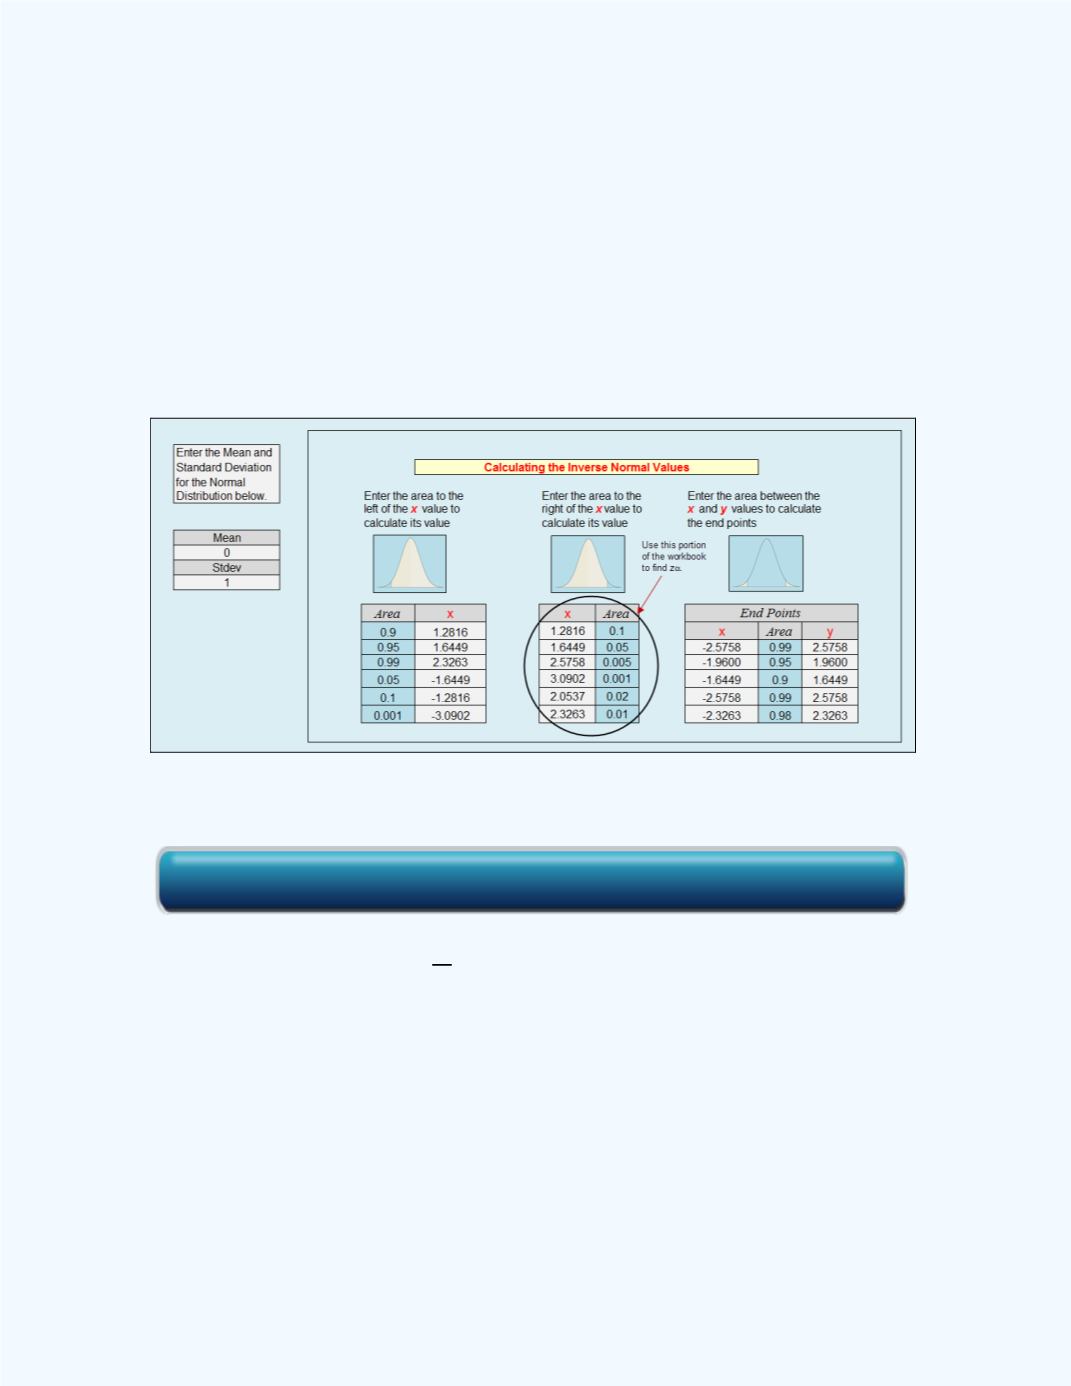
Figure
11-4
shows a sample of
or
values with the corresponding
value.
You will enter the
or the
values in the
Area
column and the
corresponding
or
⁄
value will be computed.
Figure 11-4:
Sample of Computed
or
⁄
Values
Note:
The notation
. First you have to divide
by 2 then find the
corresponding
-score value. For example, if we are given that
= 0.1, and
we need to find
, first we find
. This is equivalent to 0.1/2 = 0.05.
Thus we then would find the value of
. From
Figure 11-4
, this value
will be 1.6449.
The relationship between
and the confidence level is that the stated
confidence level is the percentage equivalent to the decimal value 1 -
. For
example, if we are constructing a 98 percent confidence interval, then
0.98 = 1 -
, from which
= 0.02.
Click here for the Inverse Normal Distribution Workbook