


 468 / 762

468
Chapter 11: Confidence Intervals – Large Samples
11- 2 Large Sample Confidence Interval for a Single
Population Proportion
In this section, we will consider estimating a single population proportion.
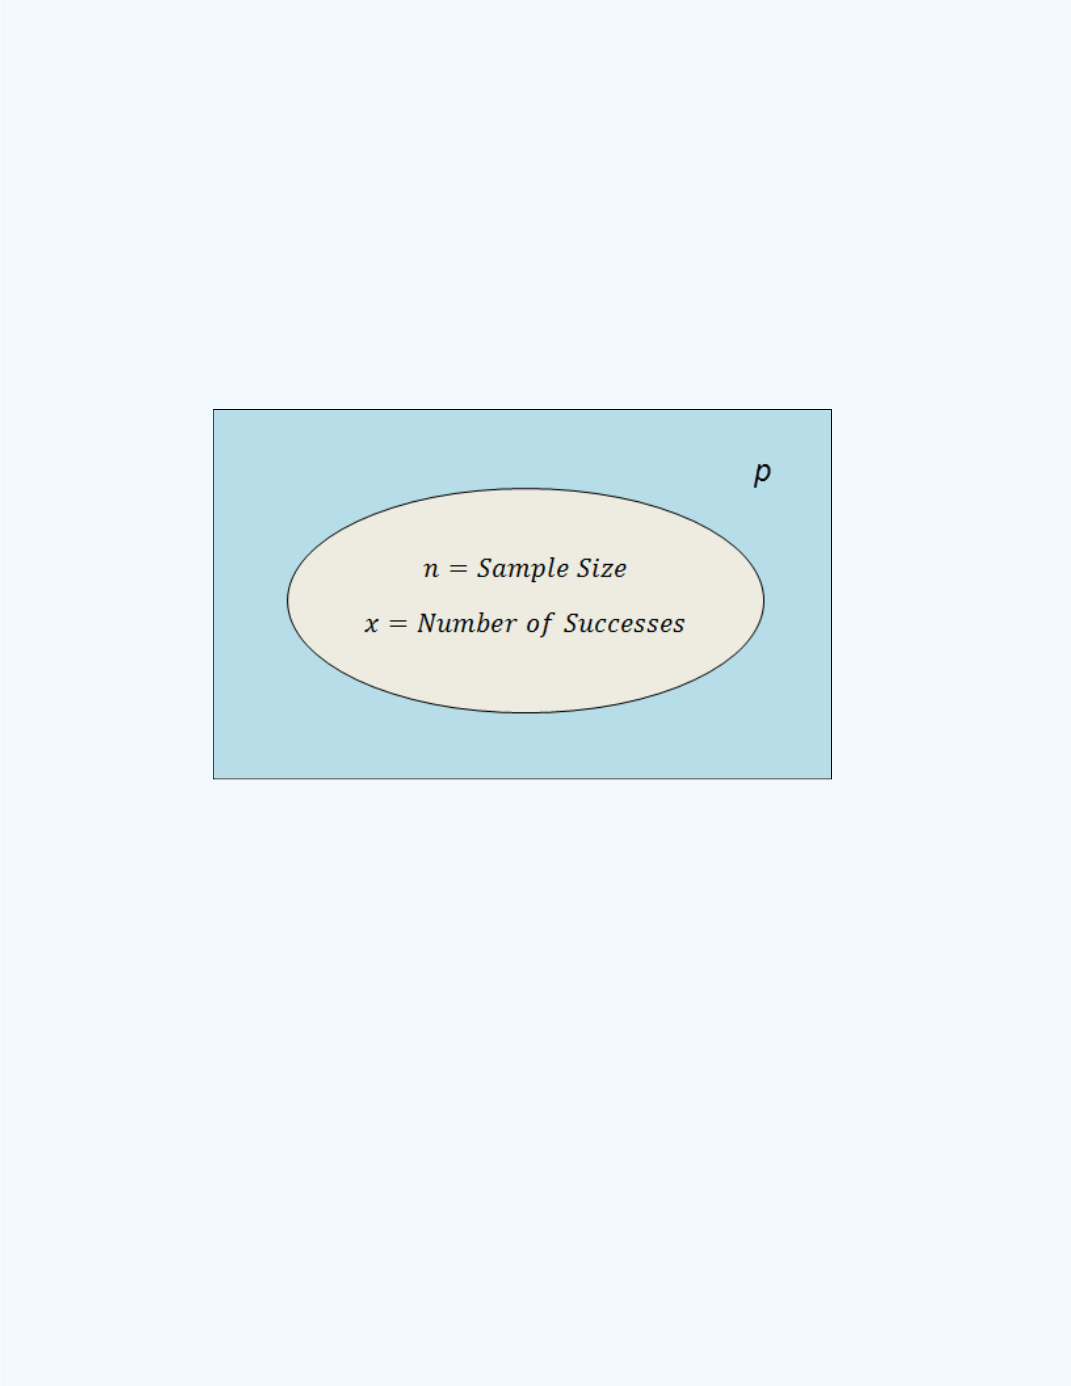
Figure 11-1
shows the design of the situation at hand. We will be sampling
from a population with an unknown proportion for a particular attribute. We
will let this population be denoted by
. A sample of size
will be obtained
and the number of successes for the particular attribute in the sample will be
recorded. We will let the number of successes be denoted by
x
.
Figure 11-1
: Display of the experimental situation in
selecting the sample to estimate the
population proportion
The point estimate for the population proportion
can be computed from
. We will let this estimate be denoted by
̂
. That is,