


 463 / 762

Chapter 10: Sampling Distributions and the Central Limit Theorem
463
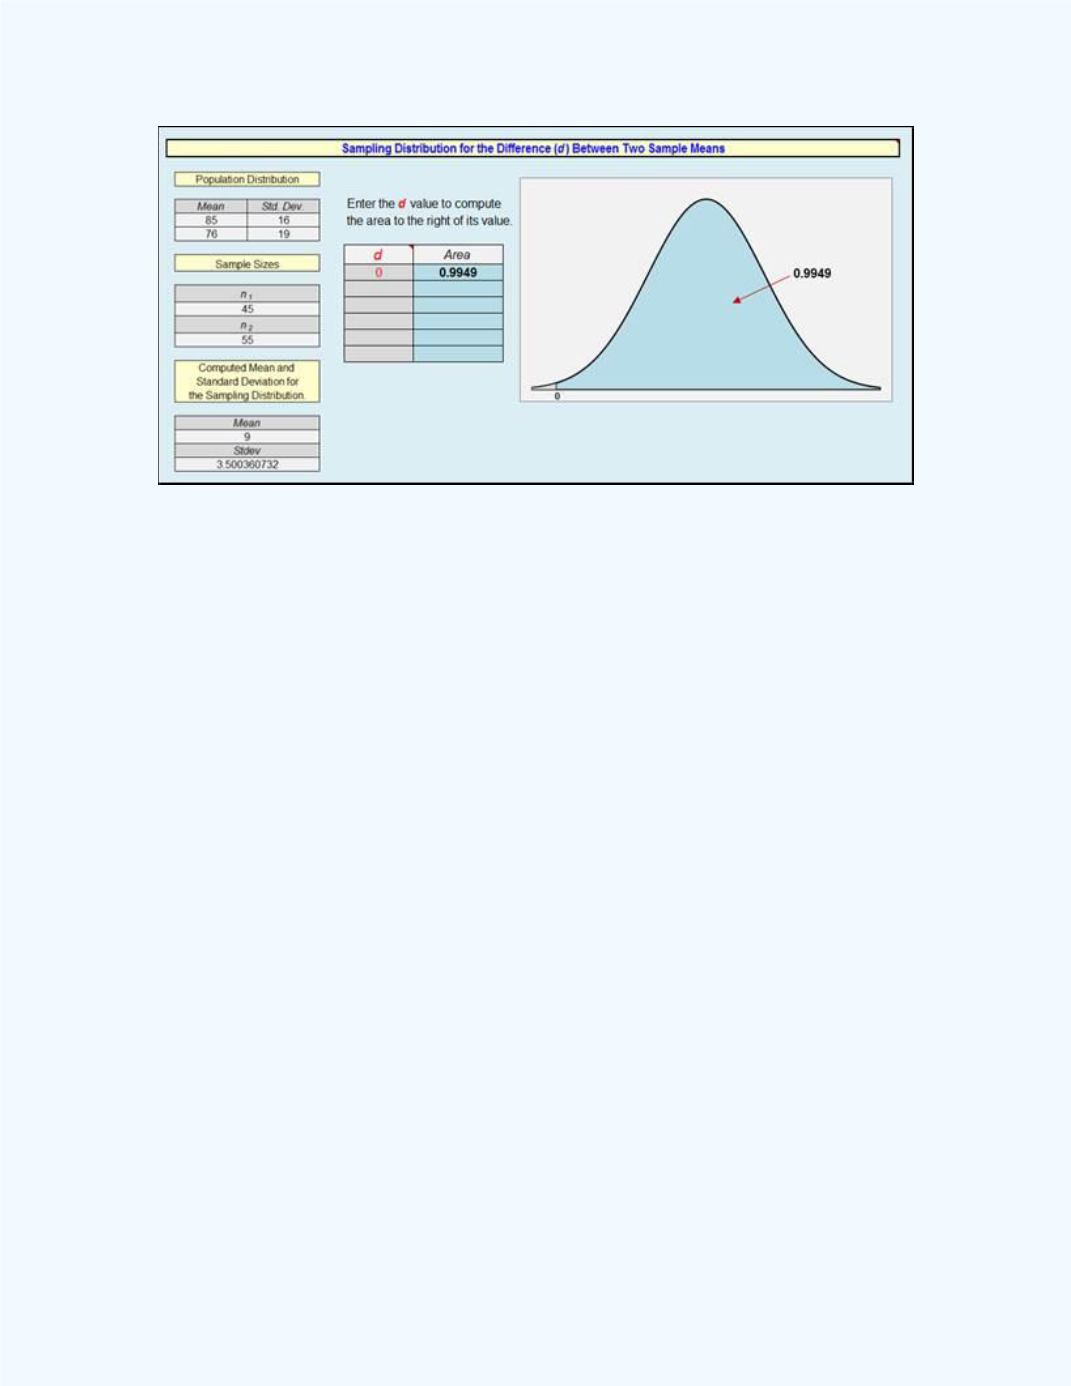
Figure 10-35:
Output for
P
(
̅
̅
0) using the
Sampling Distribution for the Difference
BetweenTwo Sample Means workbook in
Example 10-7
For the previous example, suppose that we wanted to determine
P
(7.5
̅
̅
11). We can use the
Sampling Distribution for the
Difference betweenTwo Independent PopulationMeans
to directly work
the problem.
Figure 10-36
shows the output with
P
(7.5
̅
̅
11) = 0.3820.