


 469 / 762

Chapter 11: Confidence Intervals – Large Samples
469
From
Chapter 10
, we can summarize the properties of the
Central Limit
Theorem for Sample Proportions
with the following statements:
Random samples of size
are selected from a population in which the
true proportion of the attribute of interest is
.
Provided that
> 5 and
–
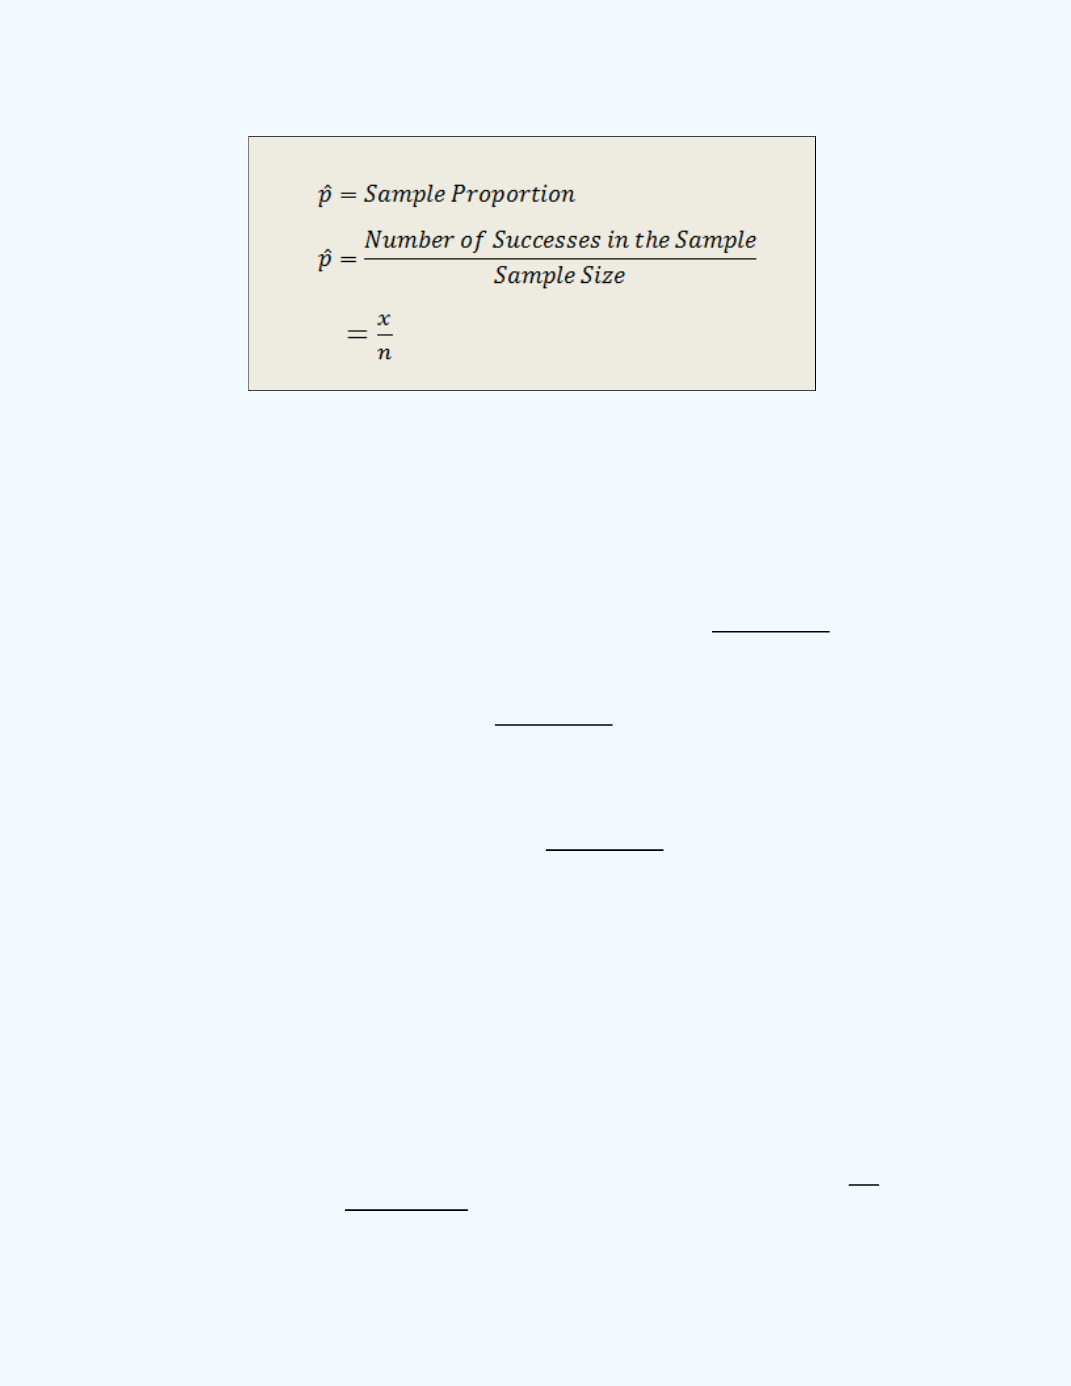
> 5, the sampling distribution of the
sample proportion
̂
will be approximately normally distributed with
mean of
̂
, and a standard deviation
of
̂
√
.
Now, in finding confidence interval estimates for the unknown parameter
,
we would need to compute
̂
√
, the standard deviation for the
sampling distribution of the sample proportion
̂
. The question then is how
do we compute
̂
, since we are estimating
, and
is unknown? A
reasonable approach would be to replace
with
̂
, the point estimate for
, in
the formulas. Thus, we will use
̂
√ ̂
̂
.
Before we state the formula relating to confidence intervals for a population
proportion, let us consider the following example.
Example 11-1:
In a random sample of 100 female high school seniors in
the United States, 85 of them said they plan to attend college after
graduation. Determine an approximate 95 percent confidence interval
estimate for the true proportion of female high school seniors who plan to
attend college after graduation.
Solution:
Since
= 100 and
(number of successes) = 85, then
̂
=
0.85. Also,
̂
√ ̂
̂
= 0.0357 (to four decimal places). The