


 464 / 762

464
Chapter 10: Sampling Distributions and the Central Limit Theorem
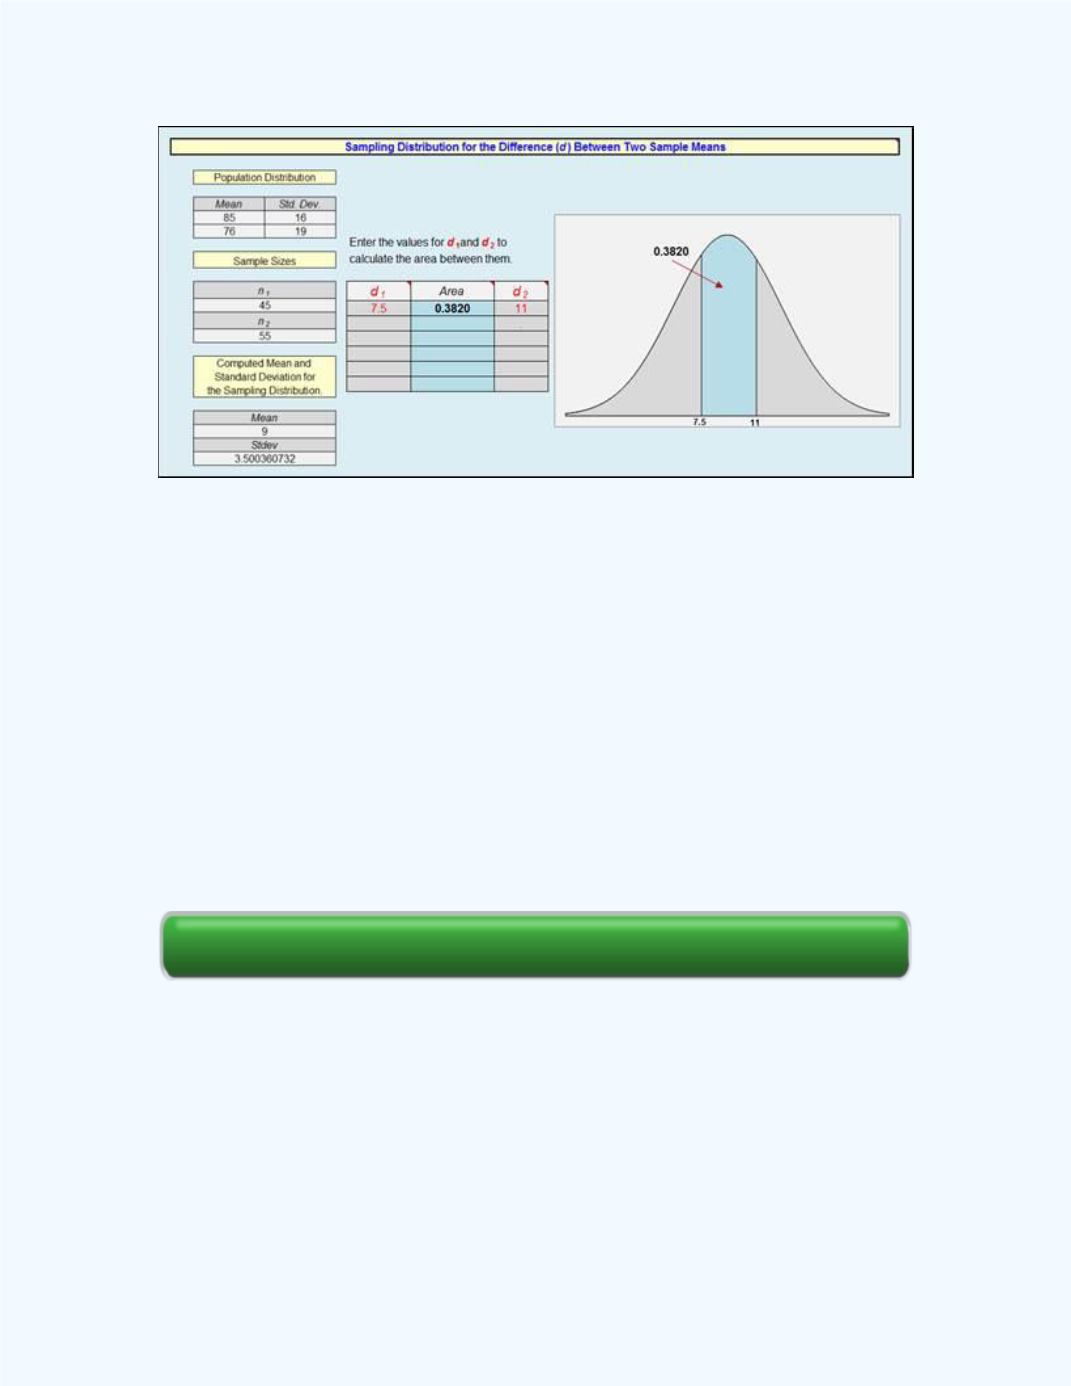
Figure 10-36:
Output for
P
(7.5
̅
̅
11
)
using the
Sampling Distribution for the Difference
Between Two Sample Means workbook in
Example10-7
Note:
If the sample sizes are large enough to apply the Central Limit
Theorem, (
n
1
30 and
n
2
30), then the assumption of normal populations
is less crucial, since the distribution of
̅
̅
will be approximately
normal
Section Review
e-Self Review