


 461 / 762

Chapter 10: Sampling Distributions and the Central Limit Theorem
461
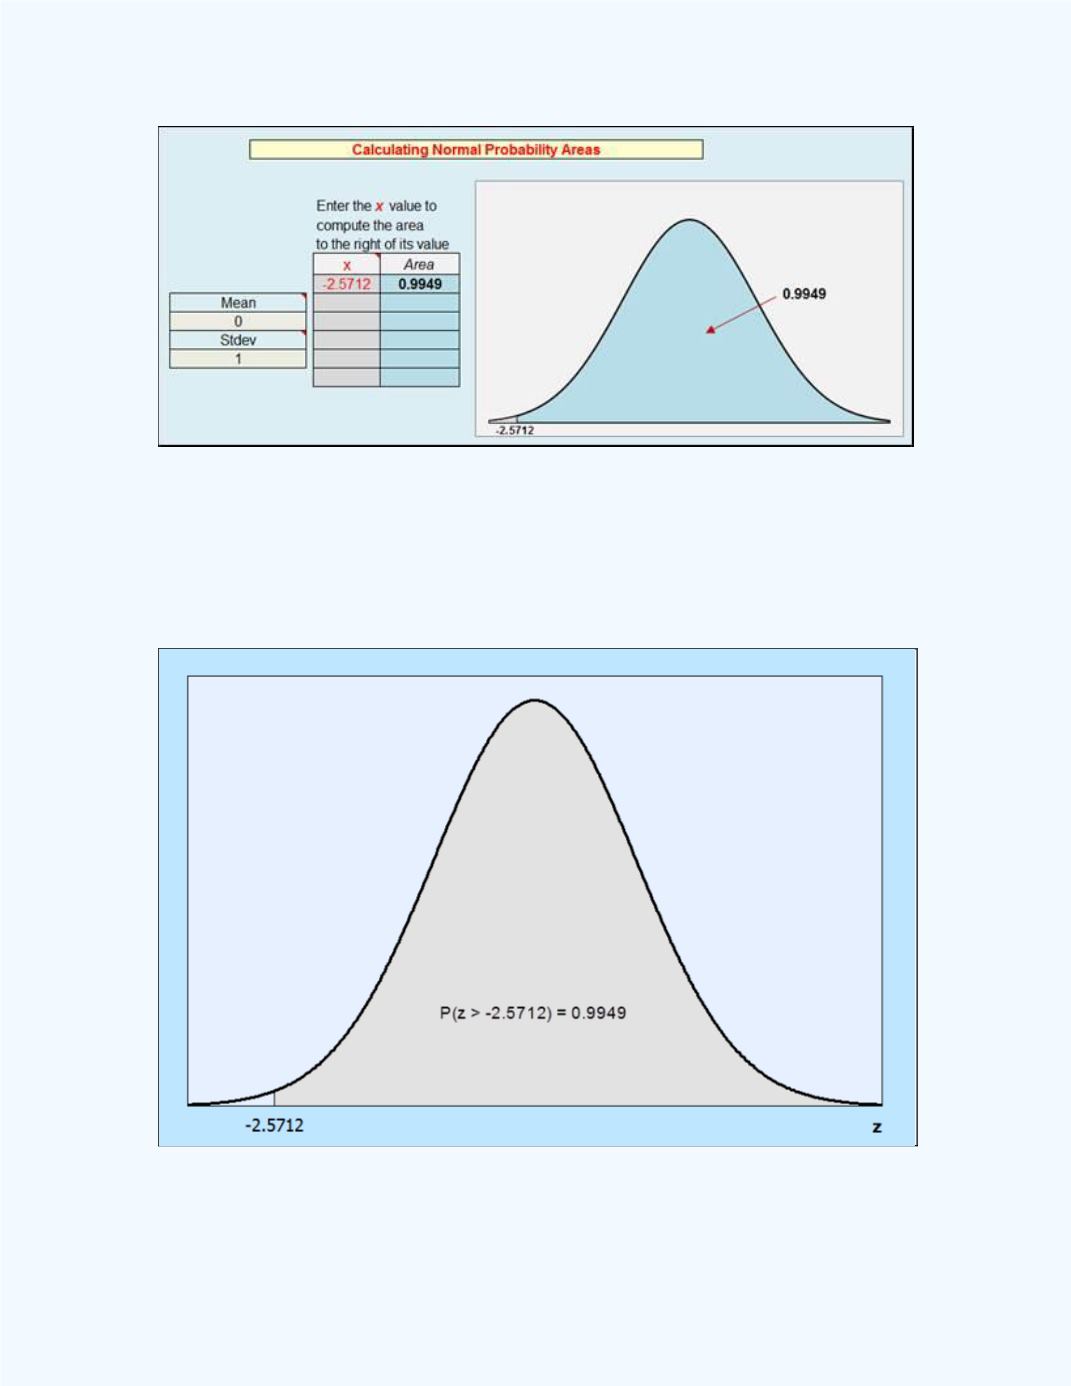
Figure 10-32:
Normal distribution output for
P
(
̅
̅
0)
using the z-score in
Example 10-7
Figure 10-33
displays the area under the standard normal curve which
represents this probability for
Example 10-7
.
Figure 10-33:
Area for
P
(
̅
̅
0) =
P
(
z
-2.5712)
Example10-7