


 456 / 762

456
Chapter 10: Sampling Distributions and the Central Limit Theorem
means.
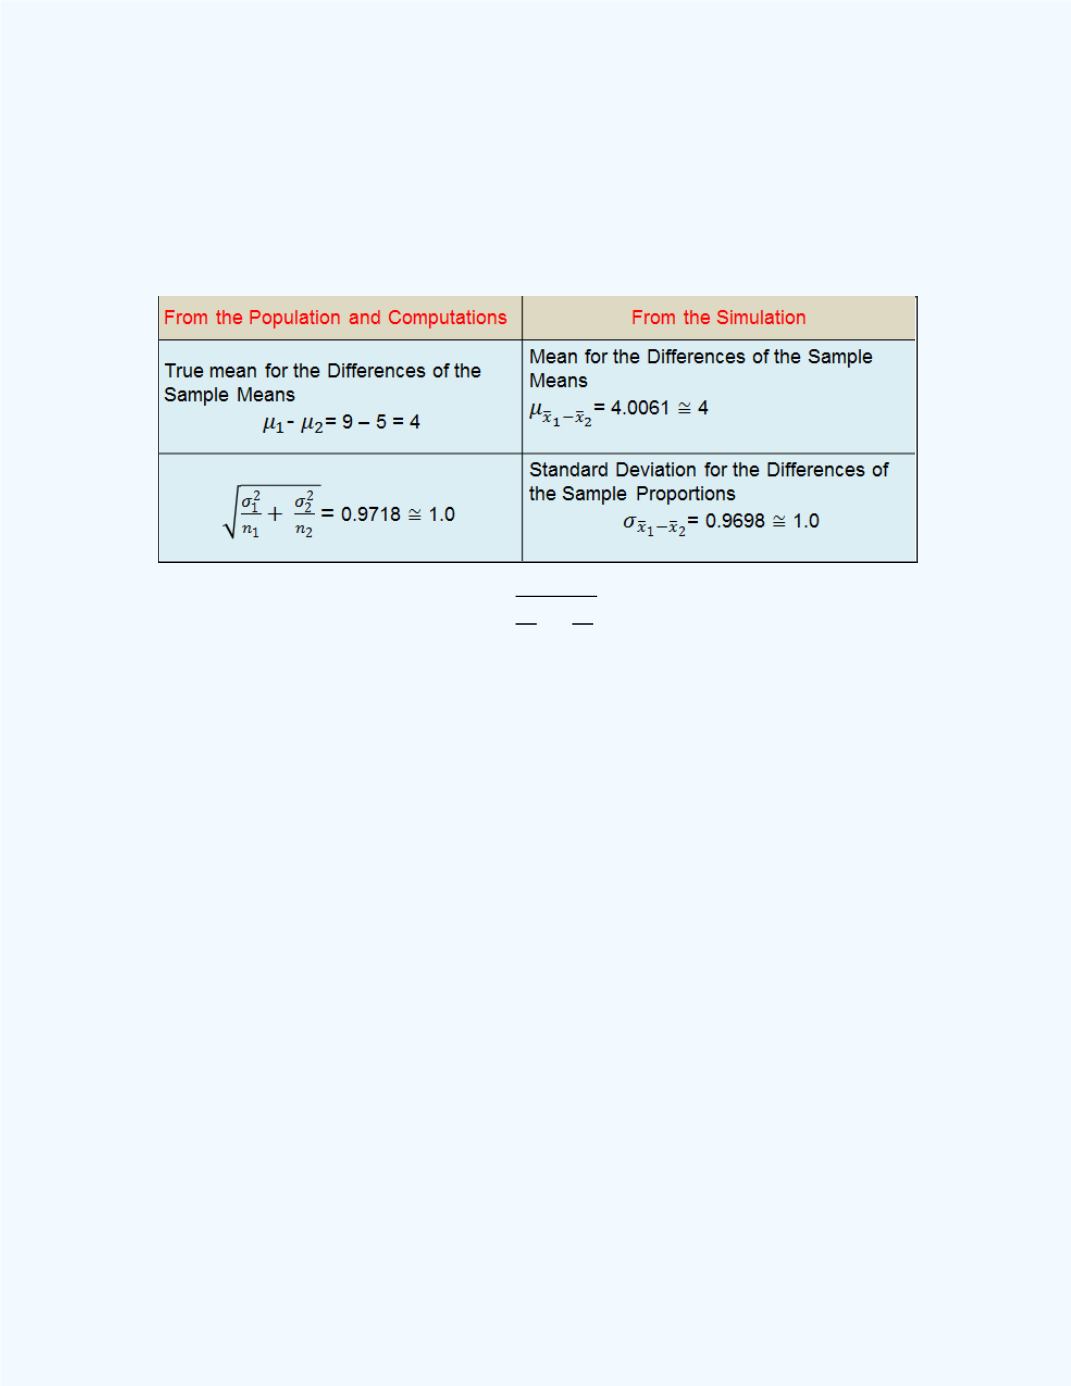
Table 10-11
shows some summary statistics for the differences of
the 1000 simulated sample means.
Table 10-11:
Some Summary Information for the Simulation
on the Difference Between two Sample Means
Observe that
-
̅
̅
and
√
̅
̅
. Again, if we
perform a large number of these simulations and take averages, we should
expect that these values to be close, if not equal, to each other in the long
run. Also, if we assume different sample sizes and different population
means and variances, we will observe similar results. The main purpose of
this illustration was to help in understanding the stated properties given in
Table 10-12
.