


 451 / 762

Chapter 10: Sampling Distributions and the Central Limit Theorem
451
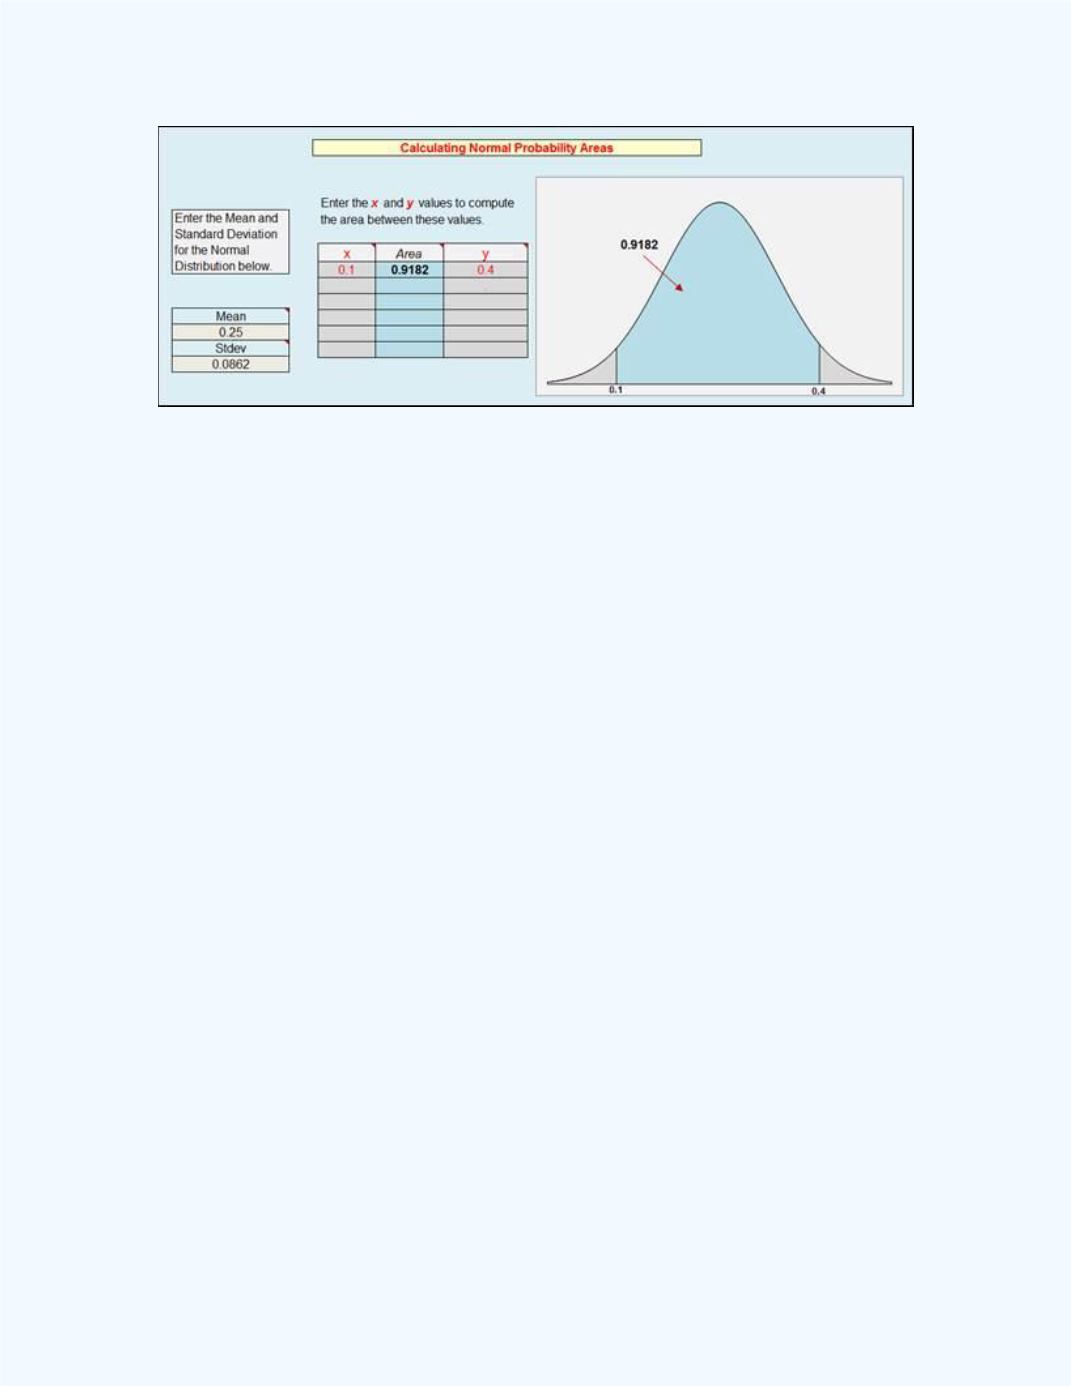
Figure 10-27:
The Normal Distribution output for
P
(0.1
̂
1
-
̂
2
0.4)
in
Example 10-6
We can also use the
Sampling Distribution for the Difference of Two
Sample Proportions
workbook to solve the problem directly. Use the
differences of 0.1 and 0.4. The output is shown in
Figure 10-28
. Observe
that the answers in
Figure 10-27
and
10-28
are the same.