


 452 / 762

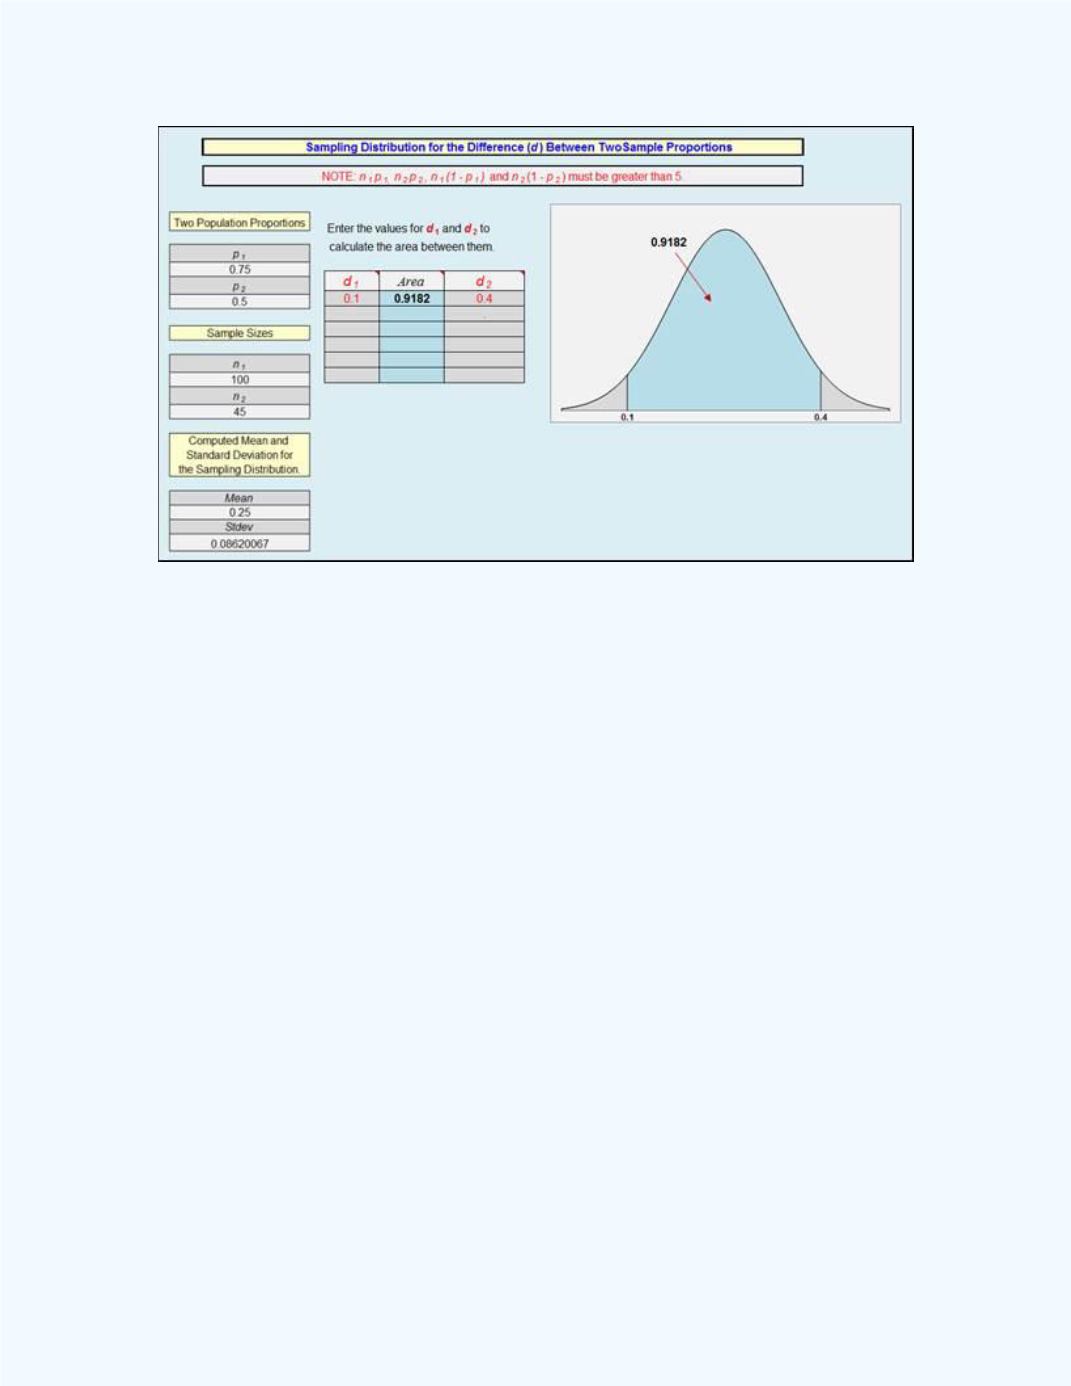
452
Chapter 10: Sampling Distributions and the Central Limit Theorem
Figure 10-28:
The
Sampling Distribution for the
Difference of Two Sample Proportions
workbook output for
P
(0.1
̂
1
-
̂
2
0.4)
in
Example 10-6
Figure 10-29
displays the area under the standard normal curve which
represents the probability for
Example 10-6
.