


 448 / 762

448
Chapter 10: Sampling Distributions and the Central Limit Theorem
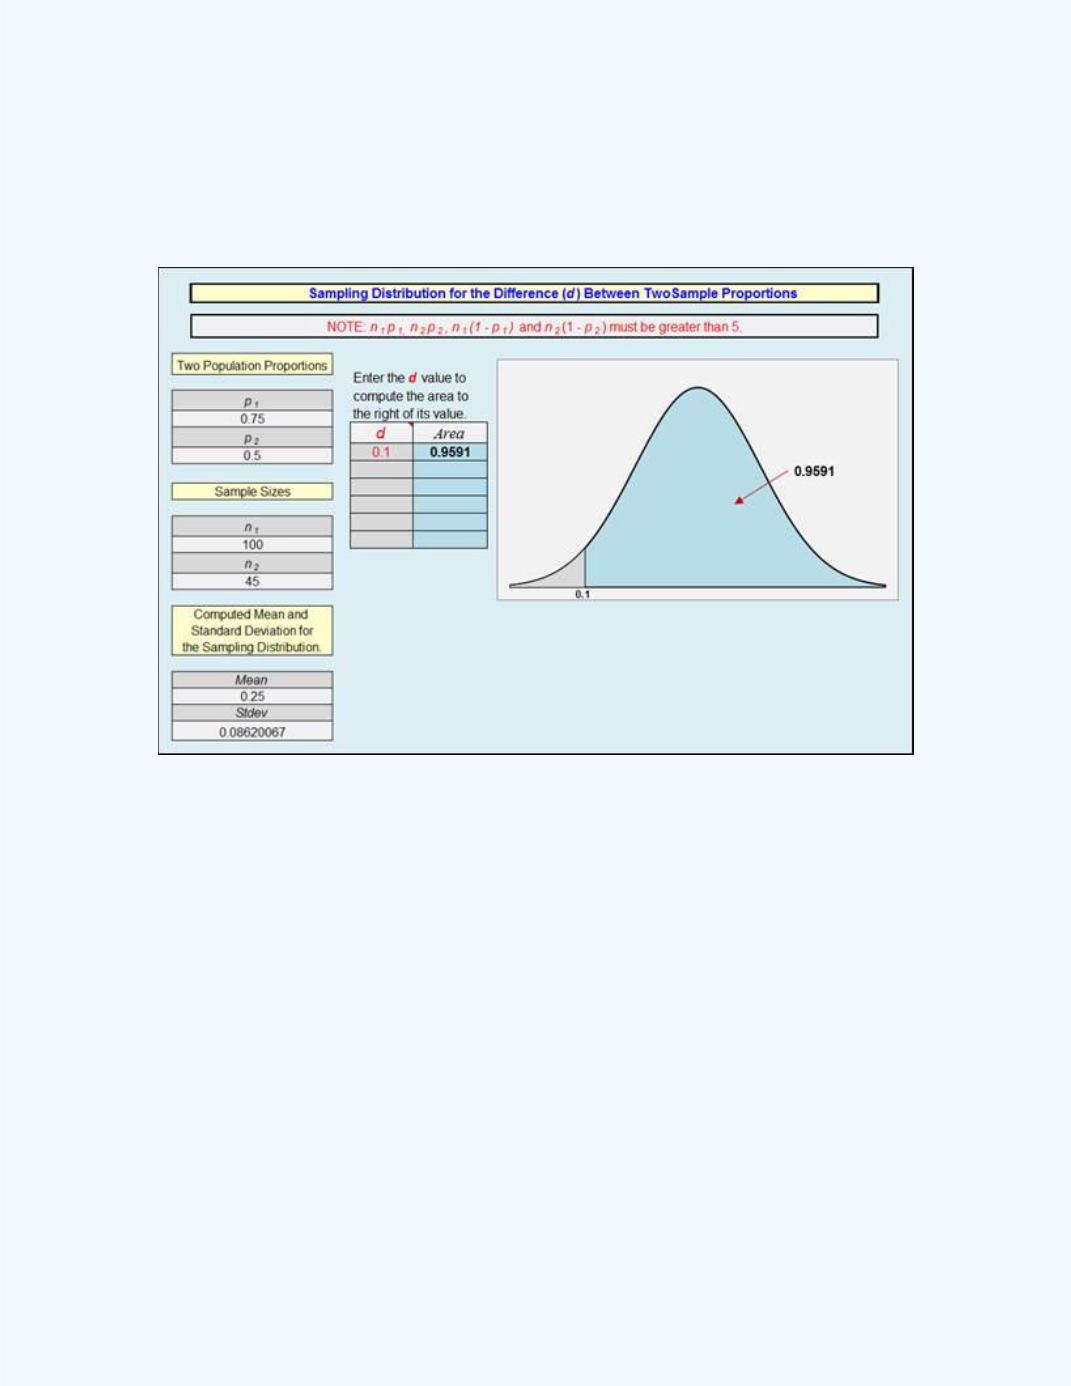
We can also use the
Sampling Distribution for the Difference of Two
Sample Proportions
workbook to solve this problem. Use the difference of
0.10. The output is shown in
Figure 10-24
. Observe in the figure that the
mean and standard deviation are the same as those previously computed.
Figure 10-24:
The Sampling Distribution Output for
Example10-5
Observe that the probabilities are the same in both
Figure 10-23
and
Figure
10-24. Figure 10-25
displays the area under the standard normal curve
which represents the probability for
Example 10-5
.