


 444 / 762

444
Chapter 10: Sampling Distributions and the Central Limit Theorem
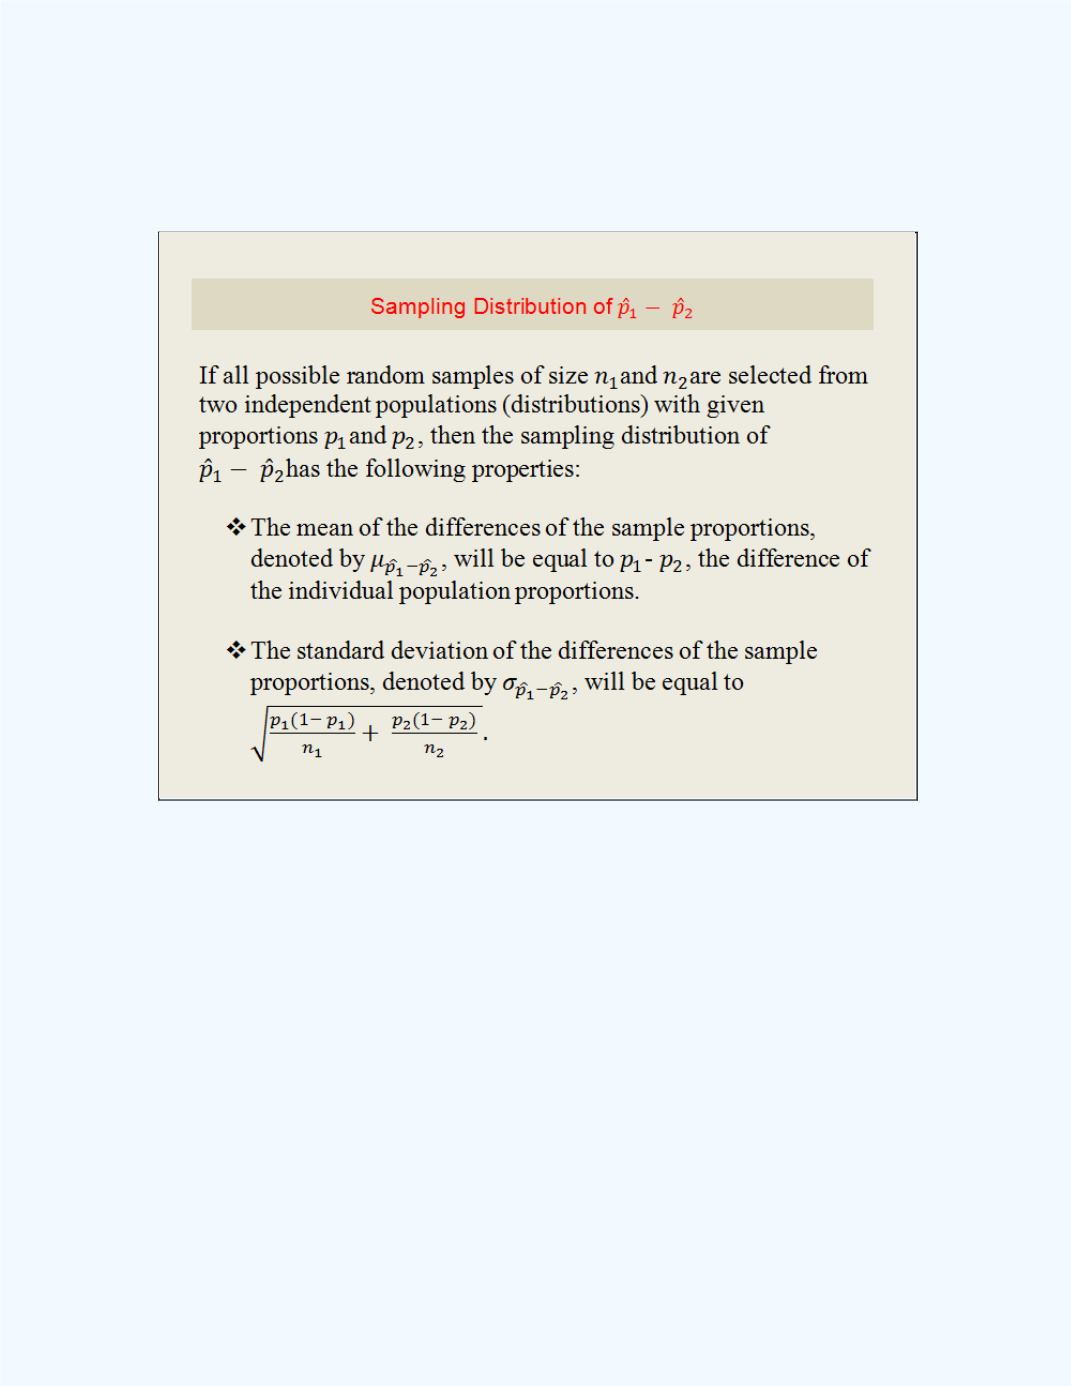
Table 10-8:
Propertiesof the sampling distribution
for the difference between two independent
sample proportions
Next we can investigate the shape of the distribution for these differences of
the sample proportions.
Figure 10-22
shows a histogram for the simulation
for this situation. Observe that the shape of the distribution of the simulated
differences of sample proportions is approximately bell-shaped or normal.
This normality approximation will get better and better as the sample sizes
from the two populations increase.
We can investigate with other sample sizes, population proportions, and
other distributions. However, we will generally observe the same properties
when
5,
5,
(1 -
5, and
(1 -
5.
We can generalize the observations in a very important theorem called the
Central Limit Theoremfor the Difference betweenTwo Sample
Proportions
. This theorem is given in
Table 10-9
.