


 441 / 762

Chapter 10: Sampling Distributions and the Central Limit Theorem
441
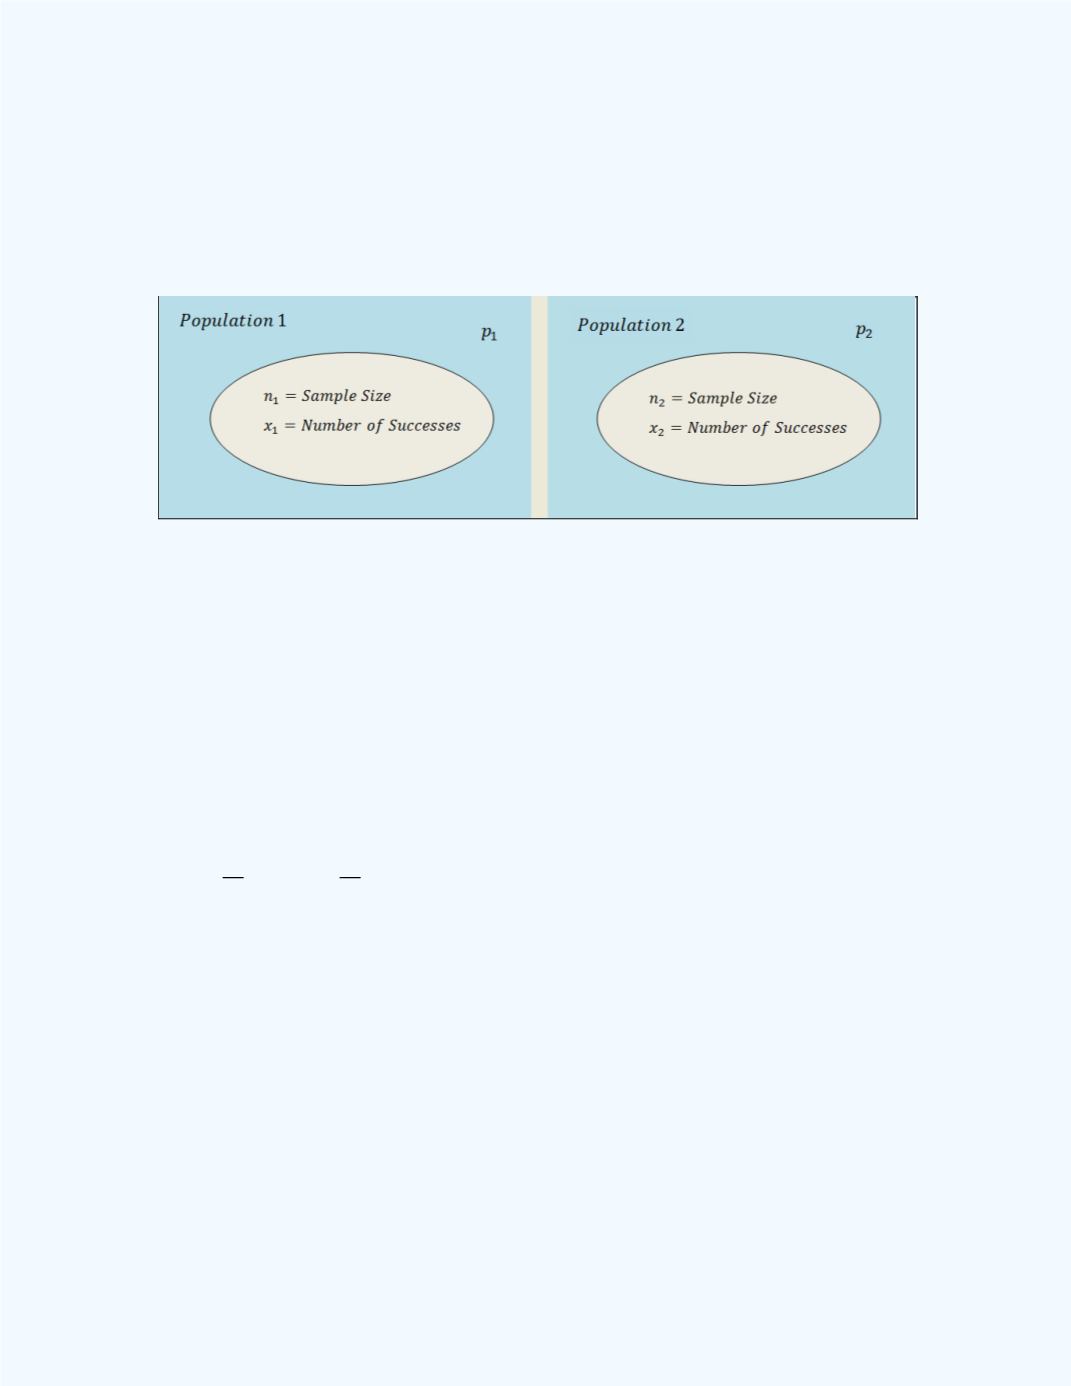
In this illustration, we will be dealing with the proportions from the two
populations consisting of males and females.
A general sampling design for such situations in the illustration is shown in
Figure 10-21
.
Figure 10-21:
Sampling Representation to Investigate the
Sampling Distribution for Two Sample Proportions
To be specific, we will let the subscript 1 be associated with population 1,
and the subscript 2 be associated with population 2. In
Figure 10-21
, the
two populations are listed as Population 1 and Population 2, from which
respective samples of sizes
and
are obtained. The numbers of
successes fromeach sample are denoted by
and
. Each population has
its respective proportion denoted by
and
. Also we will let
̂
and
̂
represent the sample proportions from population 1 and population 2,
respectively. These sample proportions are obtained by computing
̂
,
̂
.
Let us consider the difference of the two population proportions
.
The point estimate for
will be represented by
̂
̂
. We can
investigate, through repeated sampling, the
sampling distribution
of
̂
̂
We will take repeated samples from the two populations and
compute the differences for the sample proportions for these repeated
samples. Through simulations and theory, we can state some properties of
the sampling distribution
̂
̂