


 437 / 762

Chapter 10: Sampling Distributions and the Central Limit Theorem
437
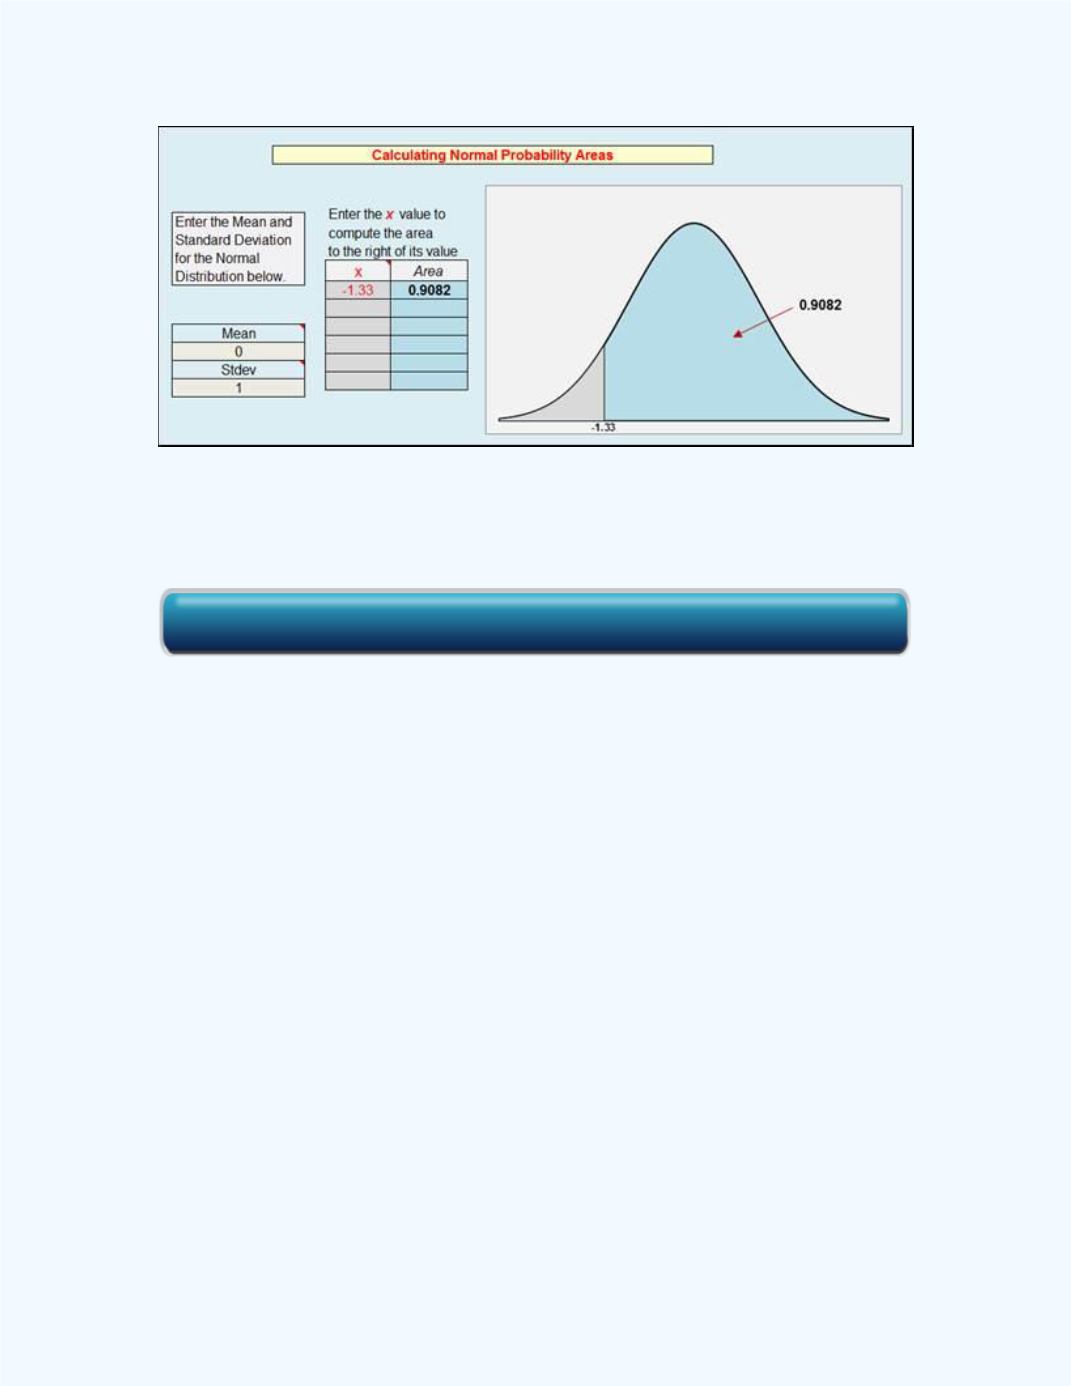
Figure 10-17:
The Normal Distribution Area for
P
(
̅ >
59,500) =
P
(z >
-1.33
) in
Example 10-3
In addition, we can also use the
Sampling Distribution of the Sample
Mean
workbook to get the answer. This is shown in
Figure 10-18
. Recall
in the original problem we did not know the sampling distribution. Hence
we will not assume normality for the sampling distribution. The output in
Figure 10-18
assumes that the sampling distribution is not normal.
Click here for the Normal Probability Distribution Workbook