


 435 / 762

Chapter 10: Sampling Distributions and the Central Limit Theorem
435
Note
: This normal approximation holds true when
30 for any non-
normal distribution. When the sampling distribution is normal, the sampling
distribution for the sample mean will also be normally distributed for any
sample size.
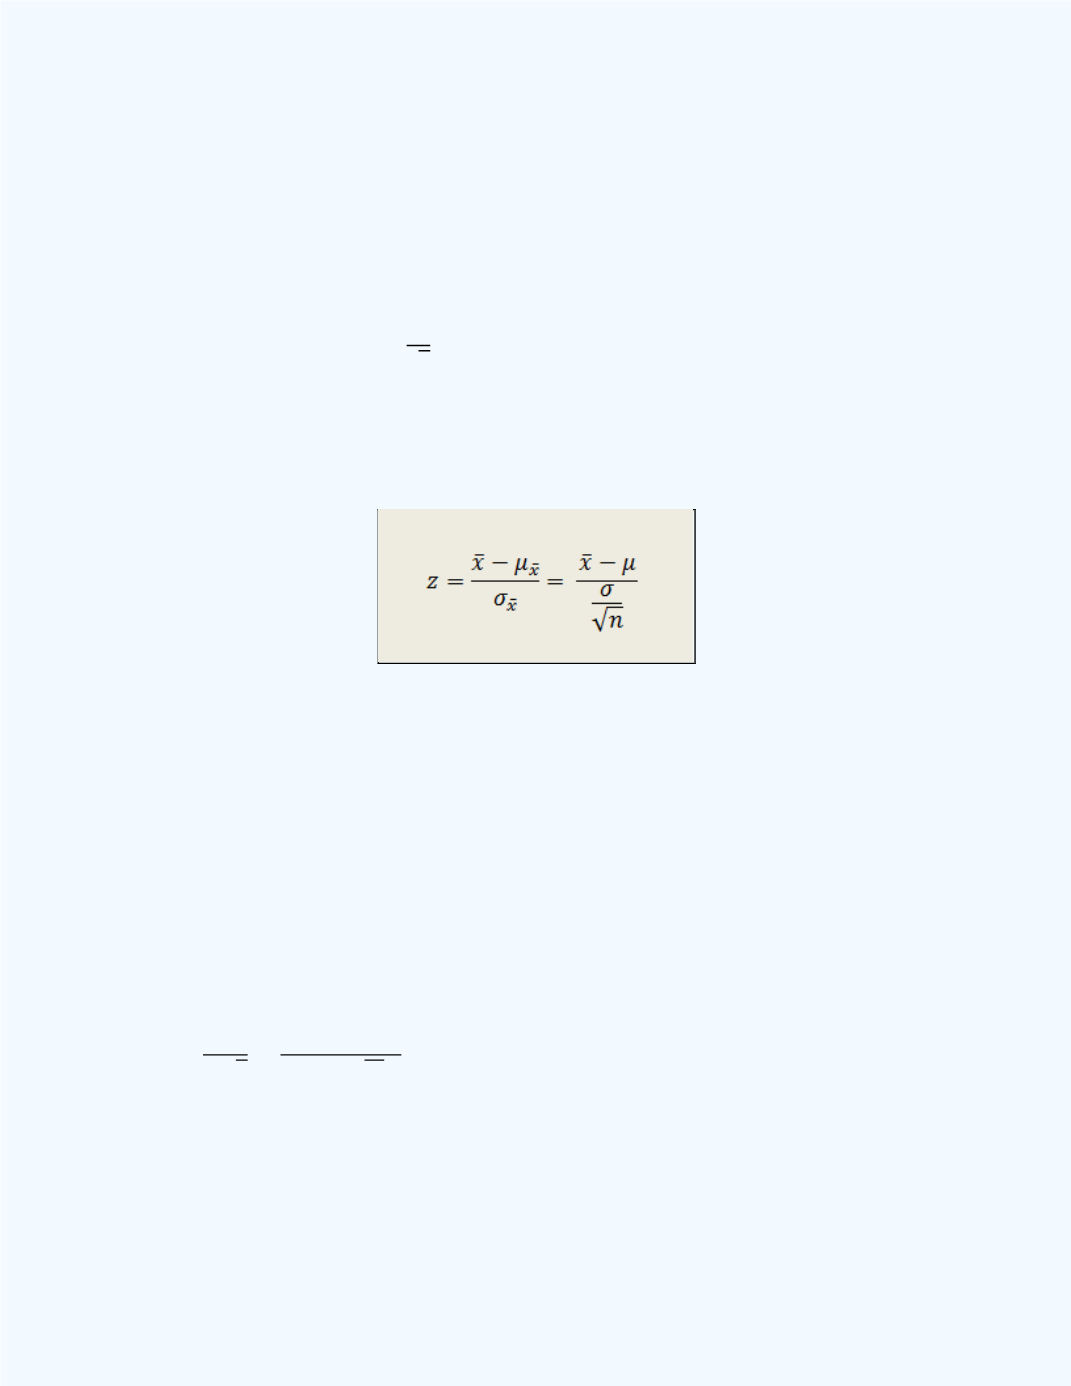
Since the sampling distribution of the sample mean
̅
is approximately
normally distributed for large enough sample sizes with
̅
, and
standard deviation
̅
√
, we can compute
z
-scores for observed
̅
values.
Also, we will be able to compute probabilities associated with these
̅
values. The equation which is used to compute the associated
-score is
given next.
Next we will present a few examples to illustrate these concepts.
Example 10-3:
A tire manufacturer claims that its tires will last an
average of 60,000 miles with a standard deviation of 3,000 miles. Sixty-four
tires were placed on test and the average failure miles, for these tires, was
recorded. What is the probability that the average failure miles will be more
than 59,500 miles?
Solution:
Observe here that we do not know the distribution of failure
miles, but the sample size is large, so we can apply the
Central Limit
Theorem
for the sample means. We need to determine
P
(
̅
> 59,500).
Now
̅
= 59,500,
= 60,000,
= 3,000, and
n
= 64. From this information,
̅
√ ⁄
. =
√ ⁄
-1.33. Thus,
P
(
̅
> 59,500) =
P
(
> -1.33) = 0.4082 + 0.5 = 0.9082.
That is, the probability that the sample mean will be greater than 59,500
miles is approximately 0.9082. This probability (area) is depicted in
Figure
10-16.