


 431 / 762

Chapter 10: Sampling Distributions and the Central Limit Theorem
431
Supposewe assume that the true mean time Americans spend working per
week during 2011 is 34.6 hours from
Figure 10-11
. Note, in general we
will not know the true mean for the population.
If we select a random sample of 50 Americans who worked during 2013, we
may observe that the average time spend working per week is 34 hours.
If we were to select another random sample of size 50, we are most likely to
obtain a different value for the sample mean.
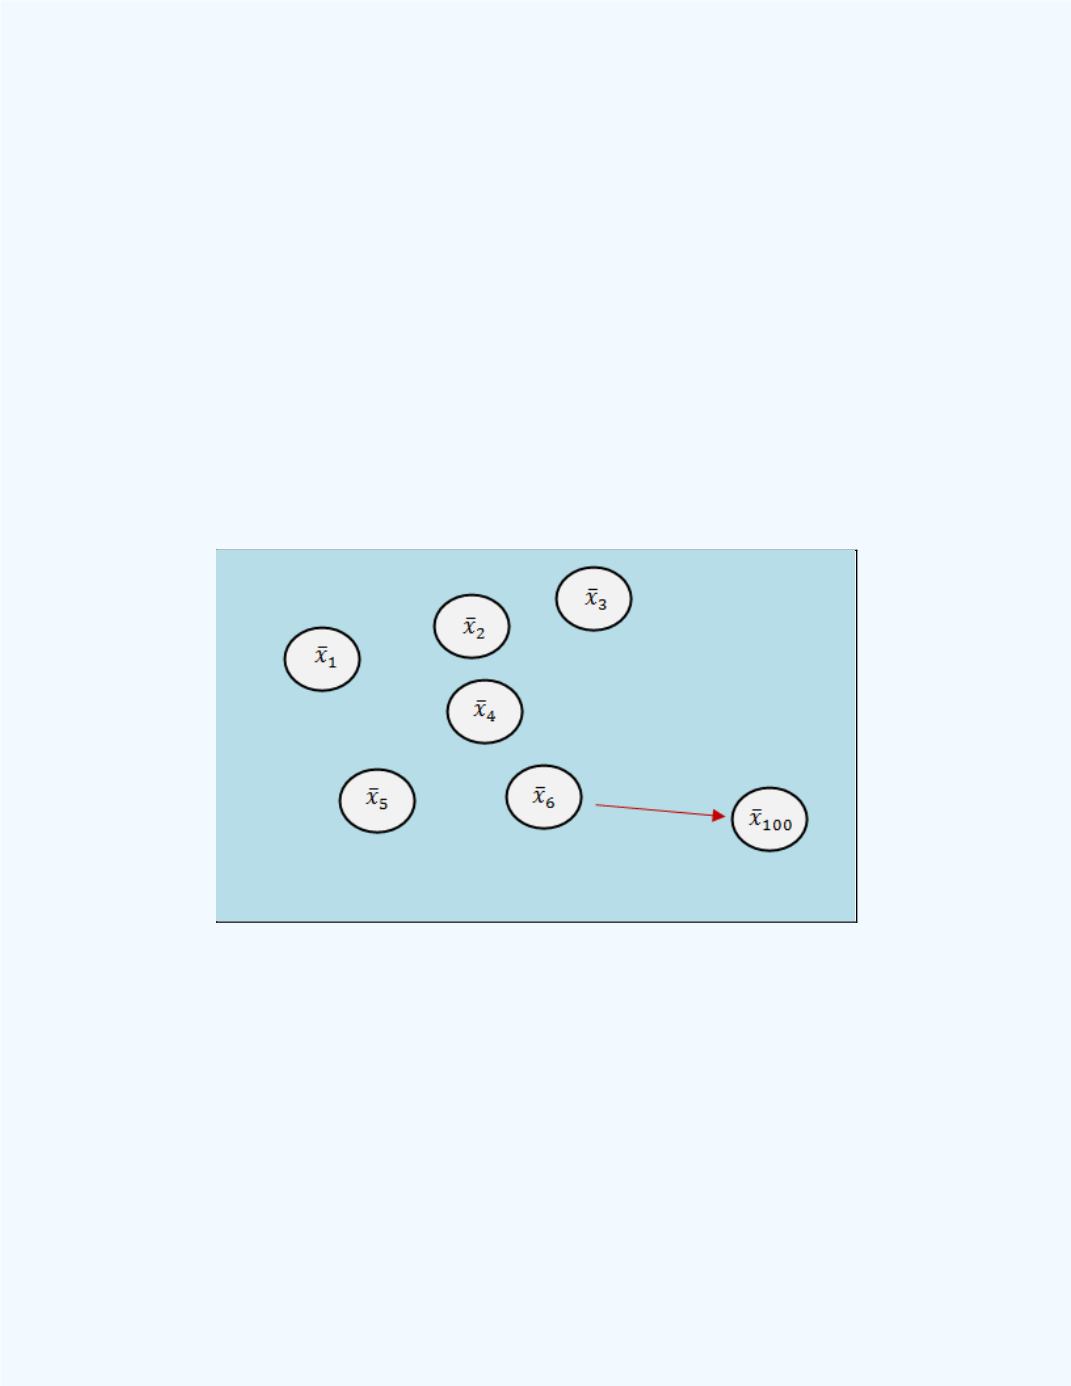
If we selected 100 different samples, say, of the same sample size, and
compute the average time spent working per week, we should not expect
these 100 sample means to all be the same. That is, there will be some
variability in these computed sample means. Pictorially, the situation is
demonstrated in
Figure 10-13
.
Figure 10-13:
Sample Means for one hundred
Samples of size 50
This one hundred sample means constitute a
sampling distribution
of the
sample mean.