


 427 / 762

Chapter 10: Sampling Distributions and the Central Limit Theorem
427
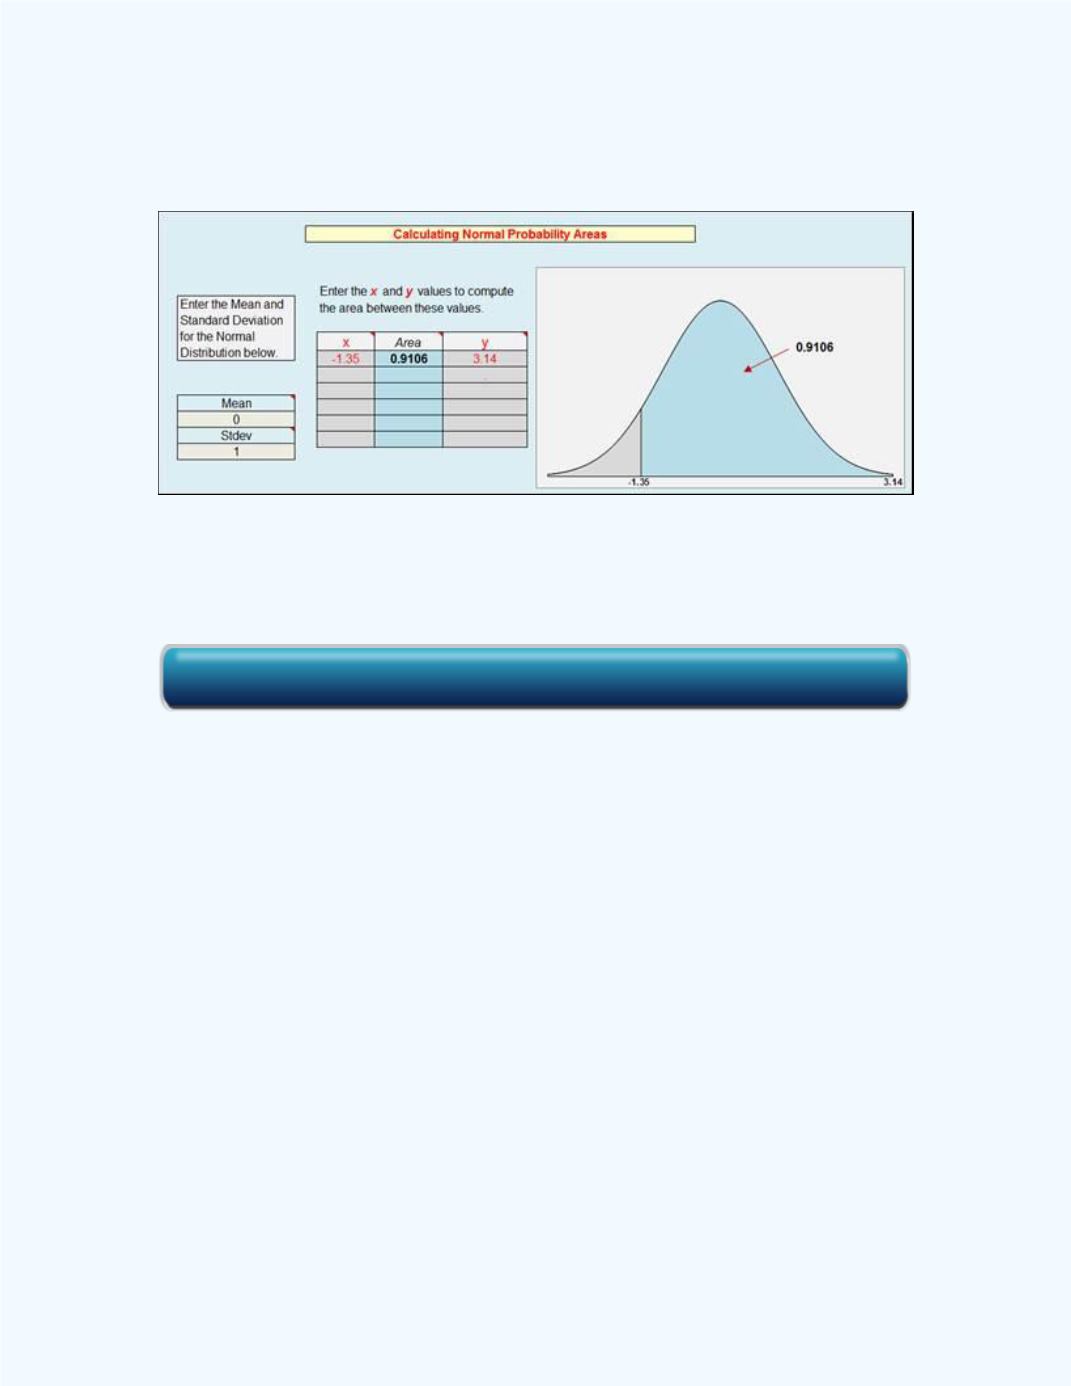
We can also use the
Normal Probability Distribution
workbook to get the
answer. This is shown in
Figure 10-9
.
Figure 10-9:
The Normal Distribution Area for
P
(0.5 <
̂
< 0.6) =
P
(-1.35 <
z
< 3.14)
in
Example10-2
We can also use the
Sampling Distribution of the Sample Proportion
workbook to get the answer. This is shown in
Figure 10-10
.
Click here for the Normal Probability Distribution Workbook