


 433 / 762

Chapter 10: Sampling Distributions and the Central Limit Theorem
433
large number of these simulations and take averages, we should expect that
these values would be closer, if not equal, to each other.
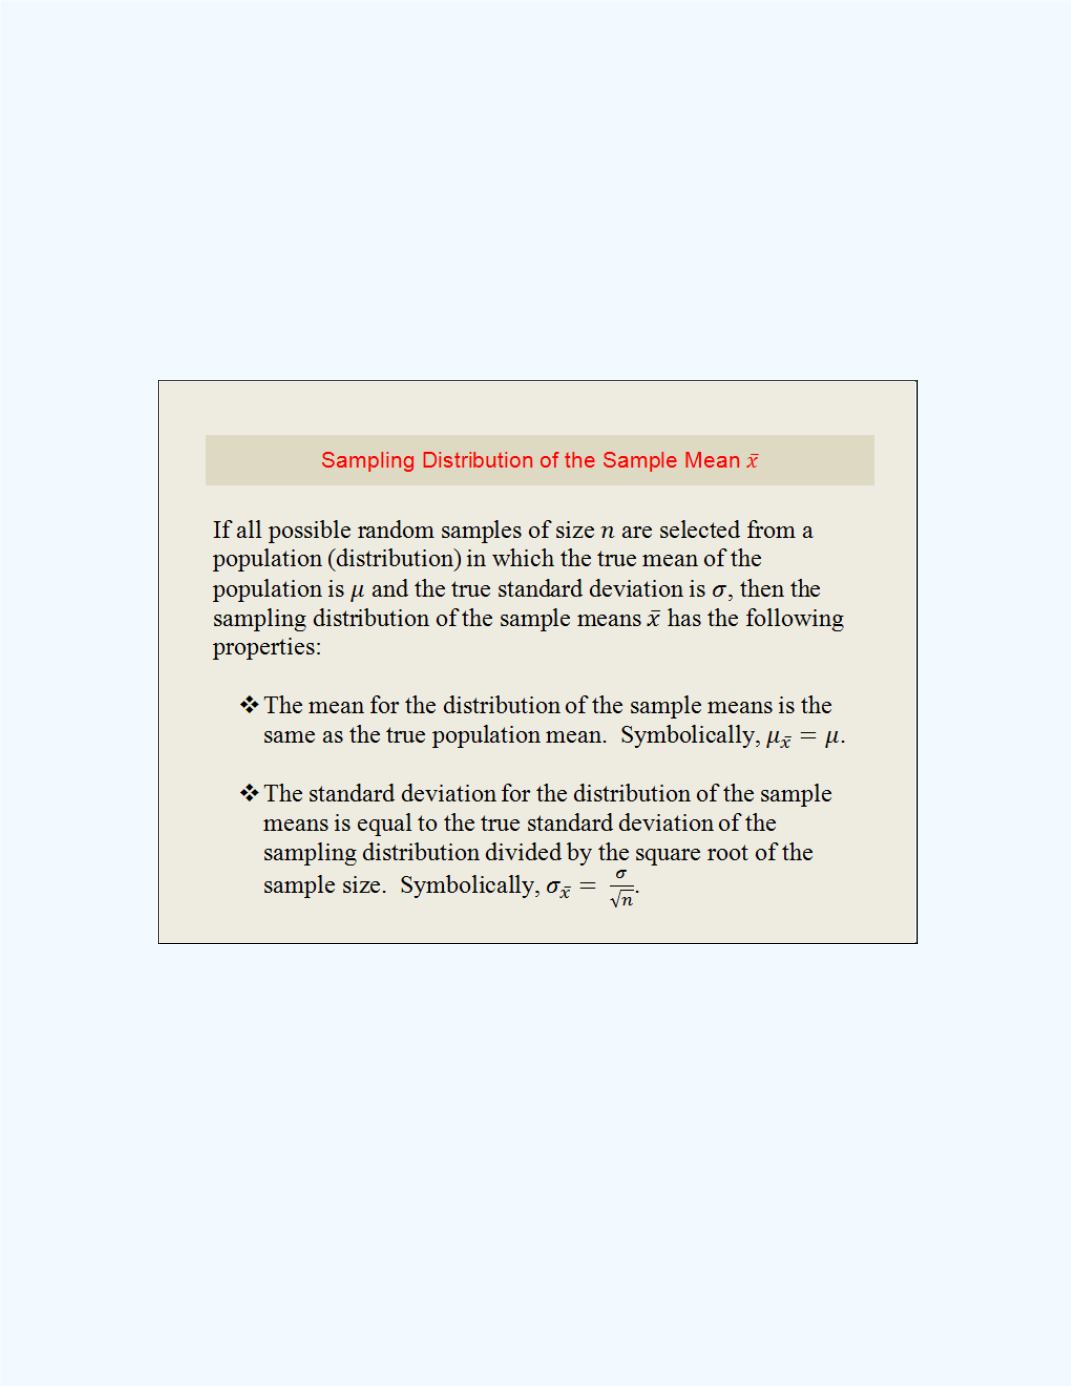
The main purpose of this illustration was to help in understanding the stated
properties given in
Table 10-5
.
Table 10-5:
Propertiesof the Sampling Distribution for the
Sample Mean
Also the shape of the distribution of the simulated sample means is
approximately bell-shaped. That is, the distribution of the sample means is
approximately normally distributed. A histogram for the simulation is
shown in
Figure 10-15
.