


 438 / 762

438
Chapter 10: Sampling Distributions and the Central Limit Theorem
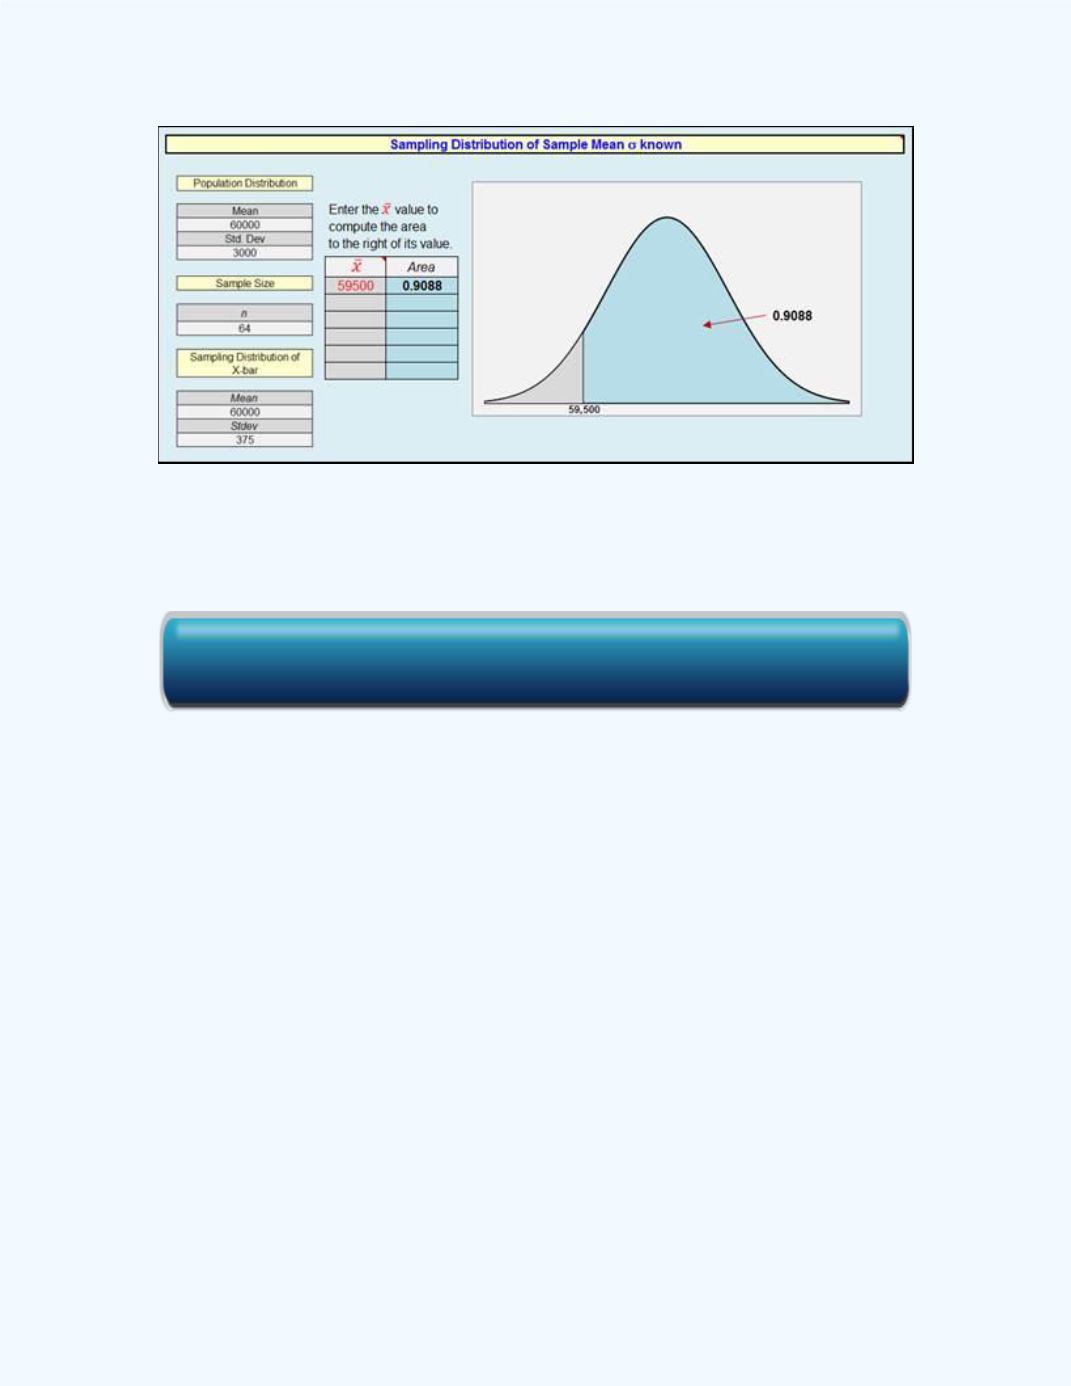
Figure 10-18:
Using the Sampling Distribution to solve for
P
(
̅
> 59,500) in
Example10-3
when the
Sampling Population is not normal
Note that the answers produced by the
Sampling Distribution of the
Sample Mean
workbook vary slightly from the answers produced by the
previous two approaches. This is due to rounding.
Example 10-4:
A supervisor has determined that the average salary of the
employees in his department is $45,000 with a standard deviation of
$15,000. A sample of 25 of the employees’ salaries was selected at random.
Assuming that the distribution of the salaries is normal, what is the
probability that the average for this sample is between $42,600 and $44,200?
Click here for the Sampling Distribution of the Sample Mean Workbook