


 429 / 762

Chapter 10: Sampling Distributions and the Central Limit Theorem
429
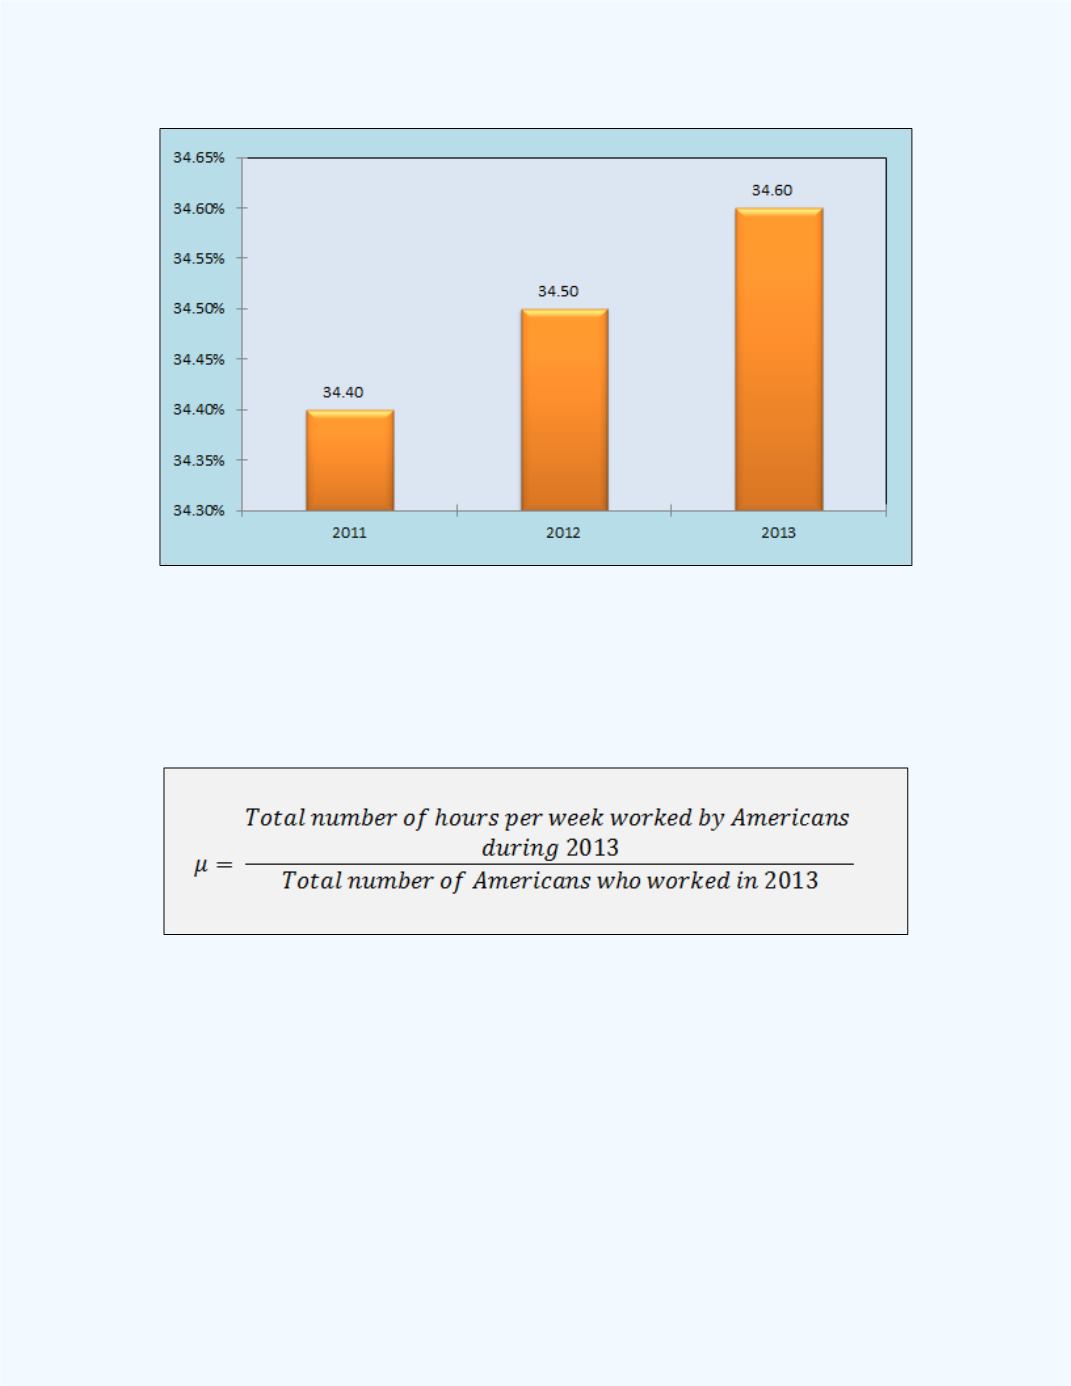
Figure 10-11:
Display with the Average Hours Worked per Week
Supposewe are interested in the true mean time Americans spend working
per week during 2013. If we let the population mean be denoted by
, then
can be defined by
Since the population of interest is too large for us to observe all Americans
who worked per week in 2013, we can estimate the true mean by observing a
random sample from the population of Americans who worked per week in
2013.
If we select a sample of size
from the population, then we can use this
information to compute an estimate for
.
Figure 10-12
shows the
experimental design of how to select the sample.