


 426 / 762

426
Chapter 10: Sampling Distributions and the Central Limit Theorem
Solution:
If we let
̂
represent the proportion of students in the sample
who will graduate in 5 years or less, then we need to find
P
(0.5 <
̂
< 0.6).
Now,
= 500,
= 0.53,
= 265 > 5, and
–
= 235 > 5. So the
normal approximation holds for the distributions of the sample proportions.
Further,
̂
= 0.53,
̂
√
=
√
= 0.0223. The
corresponding
z
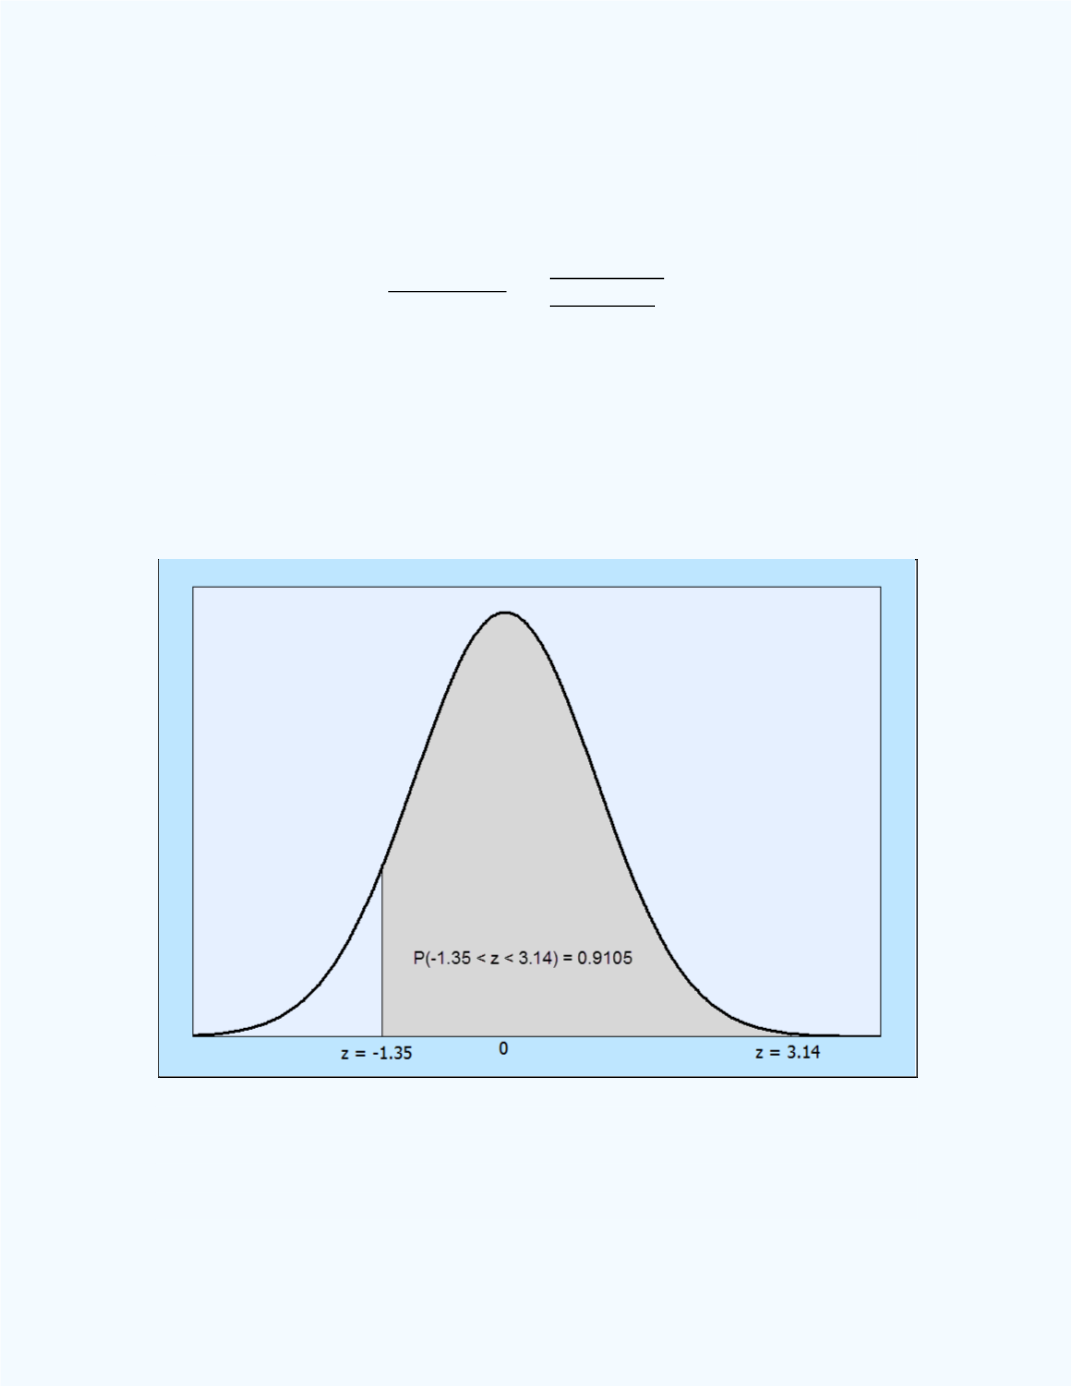
-scores are (0.5 – 0.53)/0.0223 = -1.35 and
(0.6 – 0.53)/0.0223 = 3.14. Thus,
P
(0.5 <
̂
< 0.6) =
P
(-1.35 <
< 3.14) =
0.4115 + 0.4990 = 0.9105.
That is, the probability that between 50% and 60% of the students on this
campus will graduate in 5 years or less is approximately 0.9105. This
probability (area) is depicted in
Figure 10-8
.
Figure 10-8:
Area for
P
(0.5 <
̂
< 0.6) =
P
(-1.35 <
z
< 3.14)
in
Example 10-2