


 421 / 762

Chapter 10: Sampling Distributions and the Central Limit Theorem
421
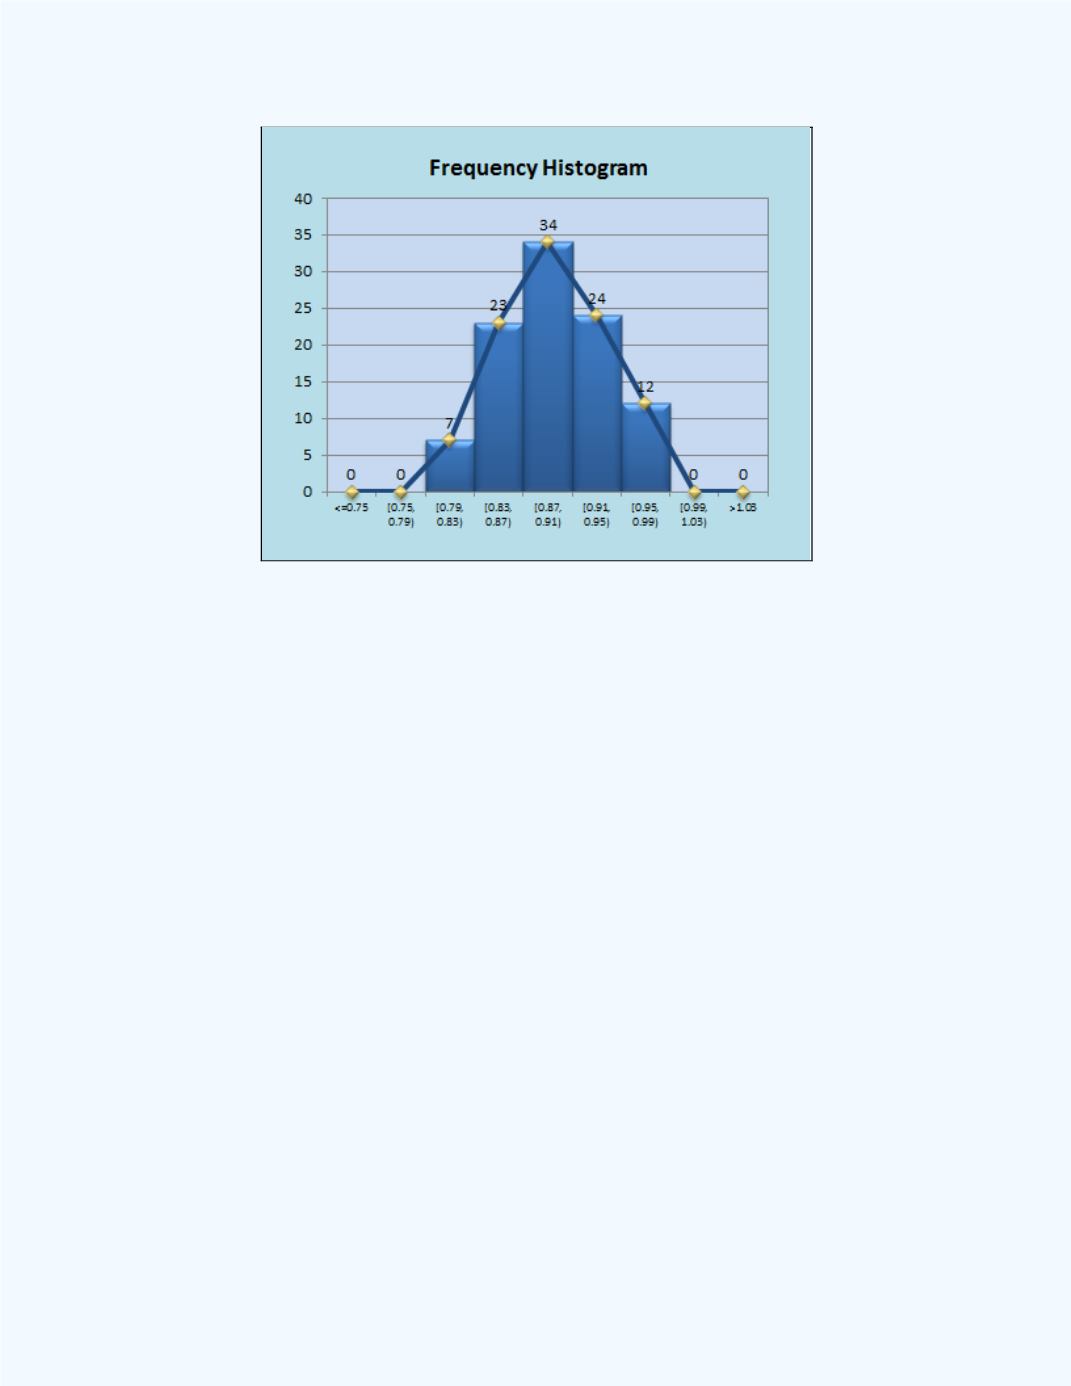
Figure 10-4:
Histogram for Simulated Sample Proportions
Observe that the shape of the distribution of the simulated sample
proportions is approximately bell-shaped. That is, the distribution of the
sample proportions is approximately normally distributed.
Of course, we can investigate with other sample sizes and probability
.
However, we will generally observe the same properties when the sample
size is “large enough” [
> 5 and
> 5]. We can generalize the
observations in a very important theorem called the
Central Limit
Theoremfor the Sample Proportion
. This theorem is given in
Table 10-3
.