


 417 / 762

Chapter 10: Sampling Distributions and the Central Limit Theorem
417
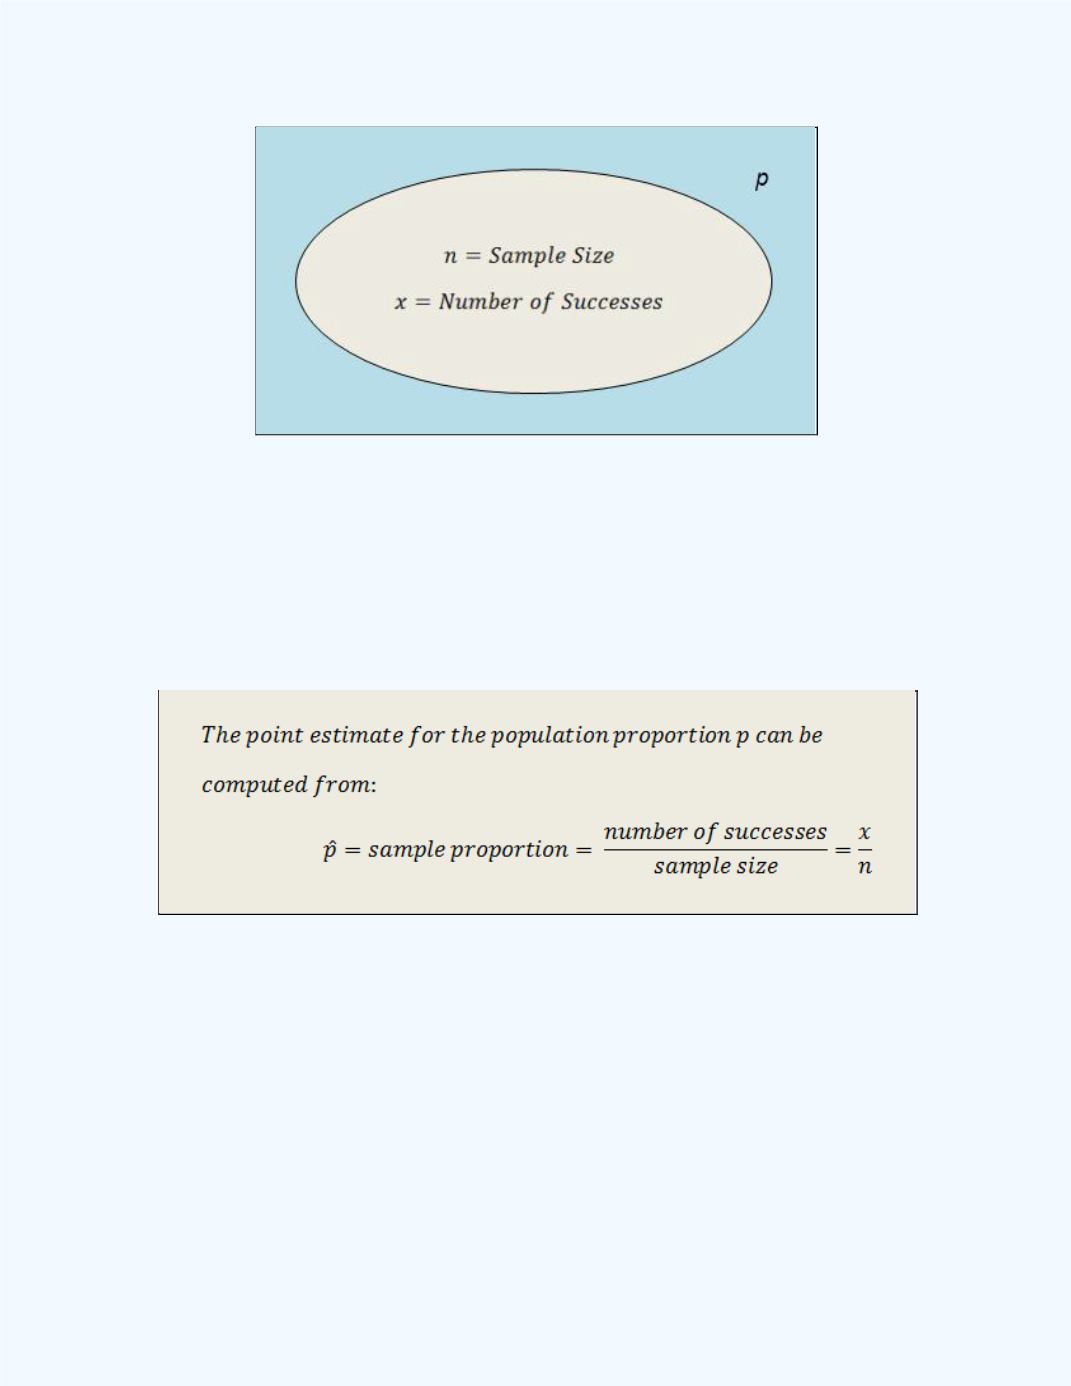
Figure 10-1:
Representationof the
Experimental Design for
Selecting a Random Sample
from a Population with Proportion
p
The general point estimate for the population proportion can then be
computed from the following relationship.
Supposewe assume that the true proportion of American parents who feel
they have the right to monitor their kids’ smartphone usage is 89 percent as
given by a USA TODAY Snapshot
(
Reference:
http://www.usatoday.com/news/snapshot.htm?section=N). In general we
will not know the true population proportion.
If we select a random sample of, say, 50 American parents, we may observe
that 35 of them feel they have the right to monitor their kids’ smartphone
usage. Thus, our sample proportion of American parents who feel they have
the right to monitor their kids’ smartphone usage for this sample will be
35/50 = 0.7 or 70 percent.