


 419 / 762

Chapter 10: Sampling Distributions and the Central Limit Theorem
419
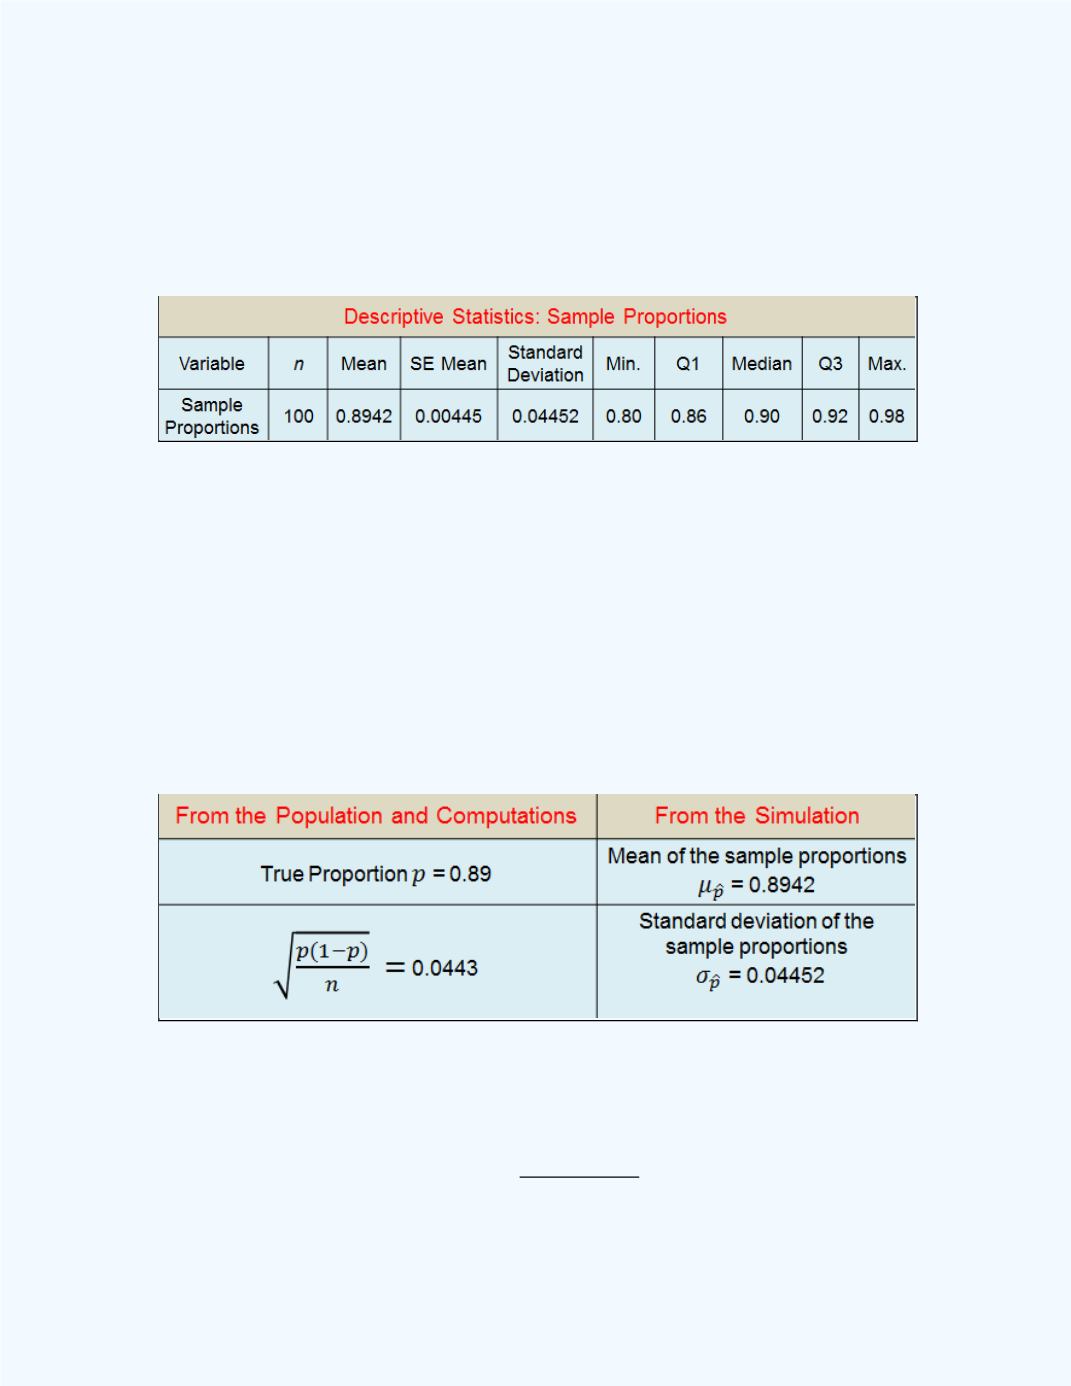
since we are interested in the proportion (number) of American parents who
feel they have the right to monitor their kids’ smartphone usage in the
sample of size 50. You may try your own simulation if you have access to
such statistical software. The descriptive statistics for a simulation is shown
in
Figure 10-3
.
Figure 10-3:
Descriptive Statistics of a Simulation
for Sample Proportions
Let
̂
represent the mean of the sample proportions, and
̂
represent the
standard deviation of the sample proportions.
Table 10-1
shows some
summary information, obtained from
Figure 10-3
, for the 100 simulated
sample proportions.
Table 10-1:
Some Summary Information for the Simulation on
Sample Proportions
Observe from the table that the values on the left side are approximately
equal to the corresponding values on the right side. Of course, if we do a
large number of these simulations and take averages, we should expect that
these values would be closer, if not equal, to each other. That is, observe
that the true proportion
̂
, and
√ ⁄
̂
, where the symbol
represents “approximately equal to”. Of course, if we do a large