


 423 / 762

Chapter 10: Sampling Distributions and the Central Limit Theorem
423
Example 10-1:
In a survey, information was gathered on how passengers
spend their time at the airport while waiting for their flight. Fifty four
percent indicated that they spend the time reading a book, magazine,
newspaper, online materials etc. If 100 passengers who are waiting on their
flight at the airport are selected at random, what is the probability that more
than 48 of them will be reading some form of material while waiting?
Solution:
If we let
X
= number of people in the sample who will read some
form of material, then
X
= 48 and
̂
= 48/100 = 0.48. Thus, we need to find
P
(
̂
> 0.48). Now,
= 100,
= 0.54,
= 54 > 5, and
–
= 46 > 5.
So the normal approximation holds for the distributions of the sample
proportions, with
̂
= 0.48,
̂
= 0.54,
̂
√
=
√
= 0.0498. The corresponding
-score = (0.48 – 0.54)/0.0498 =
-1.2048. Thus,
P
(
̂
> 0.48) =
P
(
> -1.2048) = 0.8859.
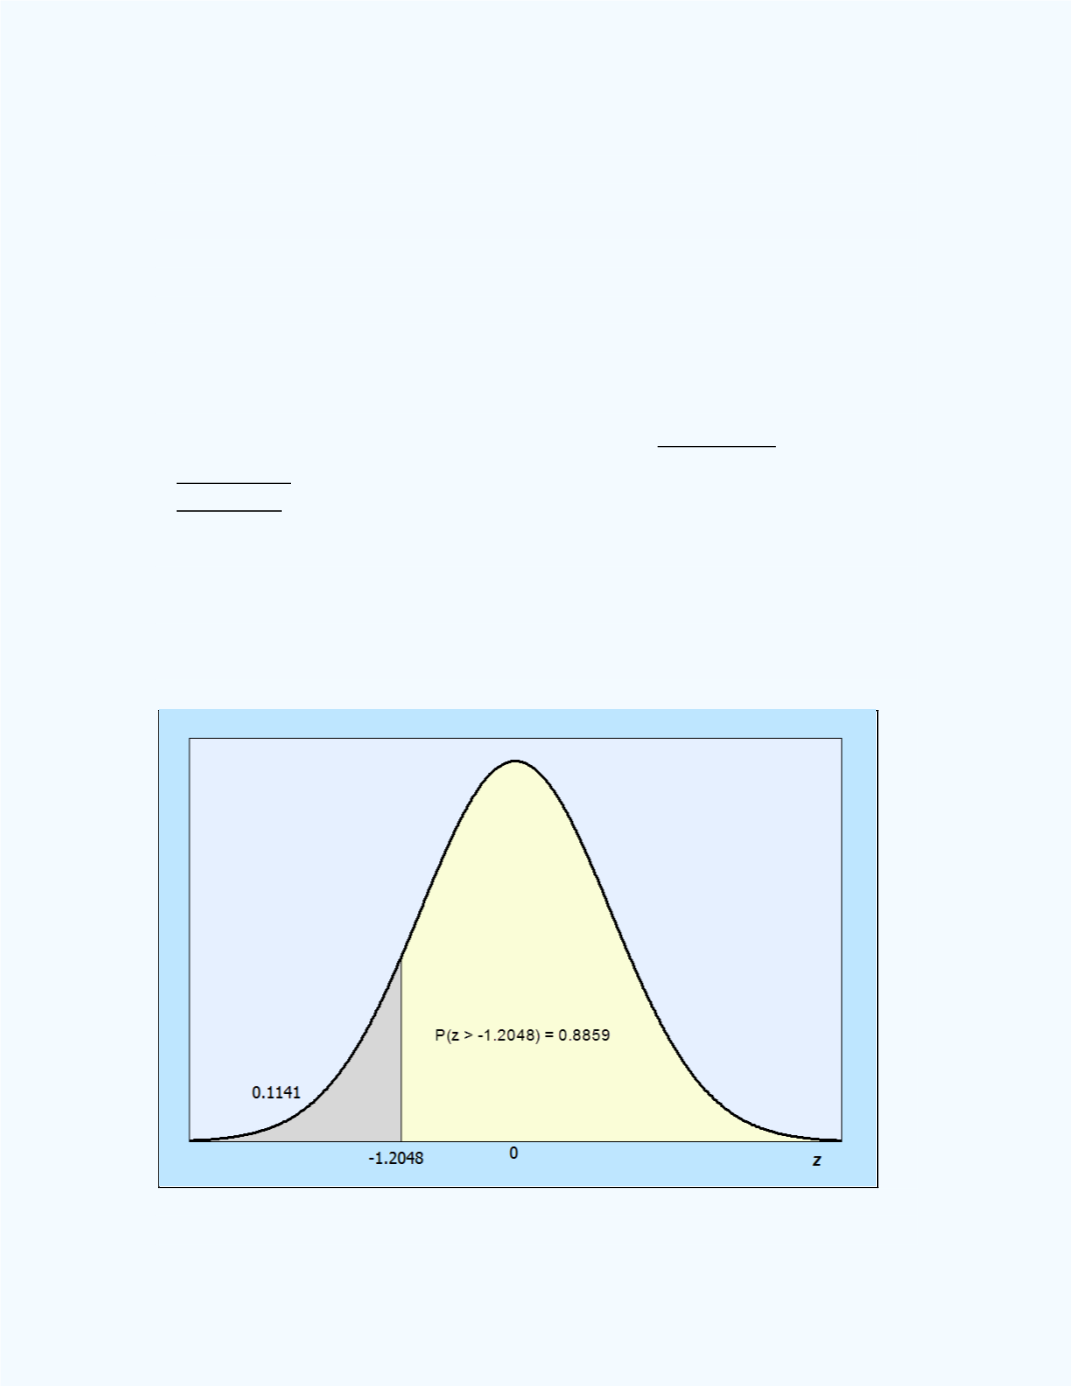
That is, the probability that the sample will have at least 48 of the passengers
who will read some form of material while waiting for their flight is
approximately 0.89. This probability (area) is depicted in
Figure 10-5
.
Figure 10-5:
Area for
P
(
̂
> 0.48) =
P
(z > -1.2048) in
Example10-1