


 424 / 762

424
Chapter 10: Sampling Distributions and the Central Limit Theorem
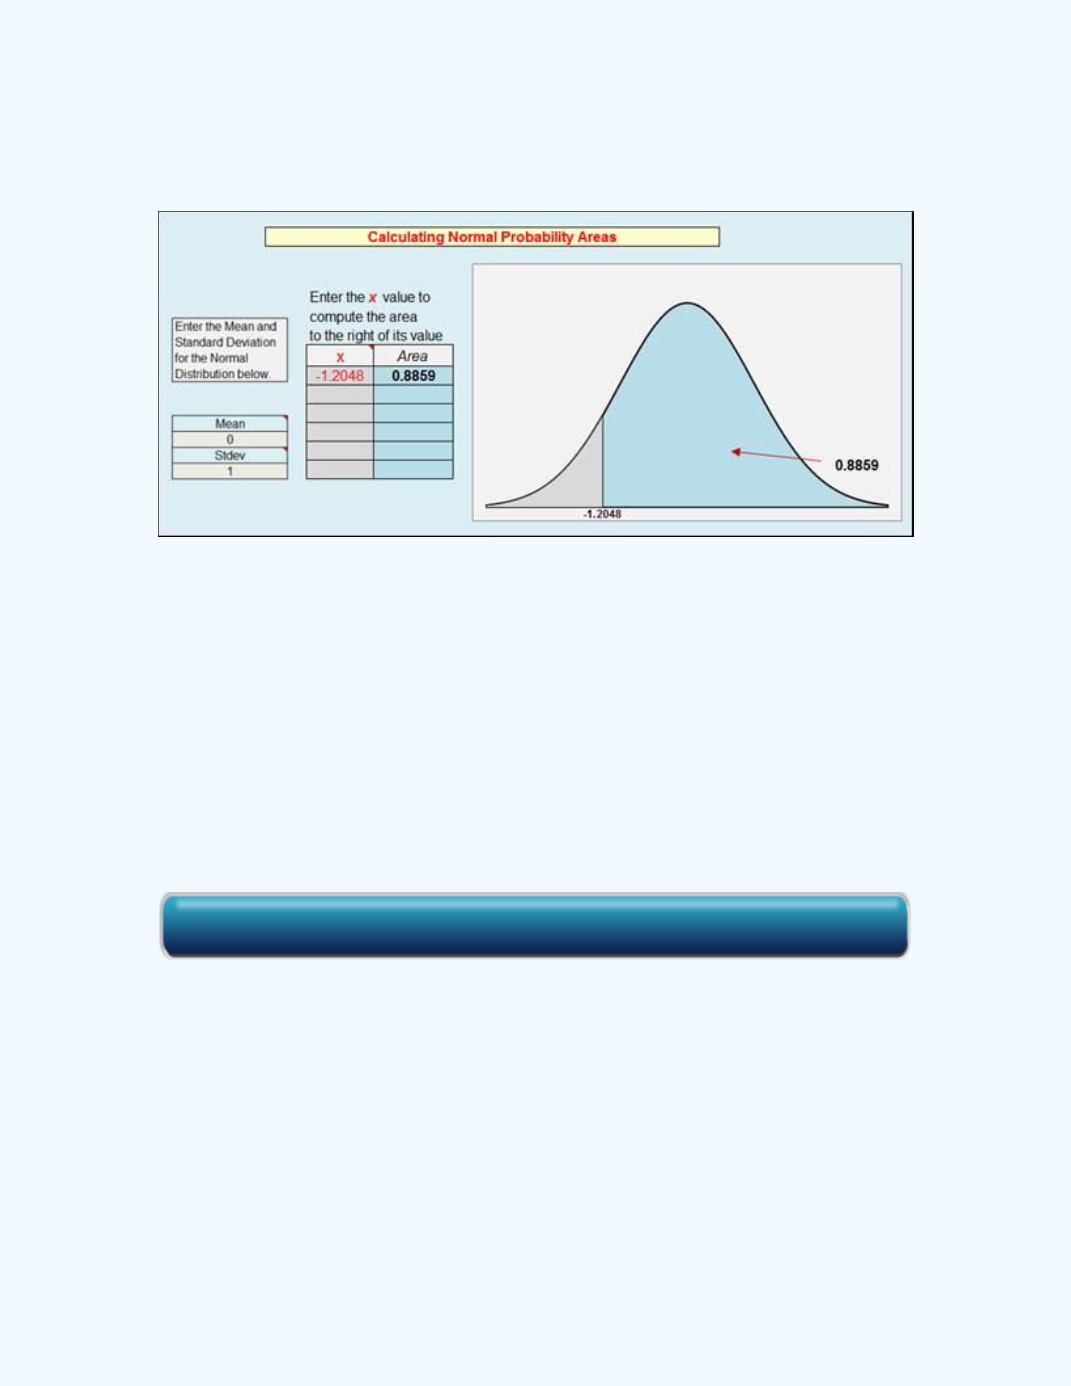
We can also use the
Normal Probability Distribution
workbook to get the
answer. This is shown in
Figure 10-6
.
Figure 10-6:
The Normal Distribution Area for
P
(
̂
> 0.48) =
P
(z > -1.2048) in
Example 10-1
Note:
In
Figure 10-6
, we used the standard normal distribution (mean = 0
and standard deviation = 1) since we transformed to a
-score. We could
have used the mean of
̂
= 0.54 and the standard deviation of
̂
=
0.0498 directly into the workbook to get the same answer. We can do this
because the conditions for the normality assumption for the distribution of
̂
were not violated (
= 54 > 5, and
–
= 46 > 5).
In addition, we can also use the
Sampling Distribution of the Sample
Proportion
workbook to get the answer. This is shown in
Figure 10-7
.
Click here for the Normal Probability Distribution Workbook