


 454 / 762

454
Chapter 10: Sampling Distributions and the Central Limit Theorem
drug 1 and drug 2, say, for the reduction of migraine headache levels. One
way of doing this, is to select a group of people who suffer from migraine
headaches at approximately the same pain level, and randomly divide into
two groups. These groups can then be treated with the two different drugs
over a period of time, and the effectiveness of the drugs for these two groups
can be determined.
In the preceding illustration, we may consider the two approximate
homogenous groups as samples from two different independent populations
who were treated with the two drugs. Information obtained about the time it
takes for the pain to reduce to a certain level can then be used to make
comparisons concerning the average times it took for the pain to reduce to
the given specified level for the two drugs.
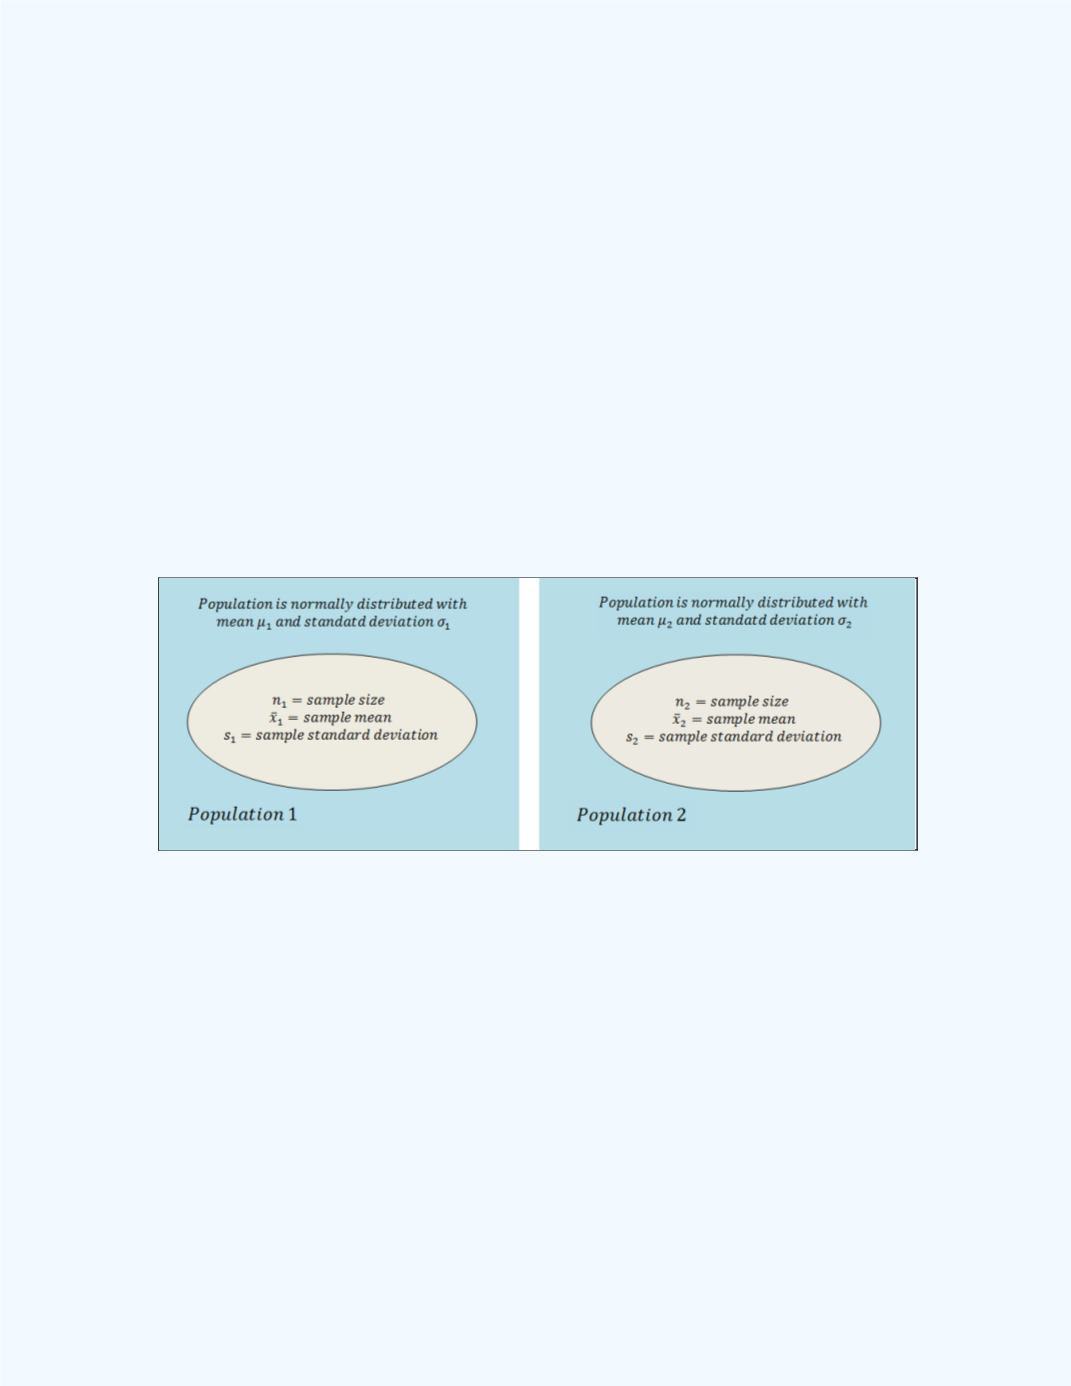
A general sampling situation is shown in
Figure 10-30
.
Figure 10-30:
Sampling Representation to Investigate the
Sampling Distribution for Two Sample Means
Figure 10-30
shows two populations, denoted as 1 and 2, from which
respective samples of sizes
and
are obtained. The respective sample
means are
̅
and
̅
and the standard deviations are
and
. Each
population has its respective mean denoted by
and
and standard
deviation
and
. Assume that these populations are normally distributed.
We can use the difference between the two sample means as a point estimate
for the difference between the population means. That is, we will let
̅
1
-
̅
2
represents the point estimate for
-
. We can then investigate the
sampling distribution
of
̅
1
-
̅
2
by taking repeated samples from the two