


 409 / 762

Chapter 9: The Normal Probability Distribution
409
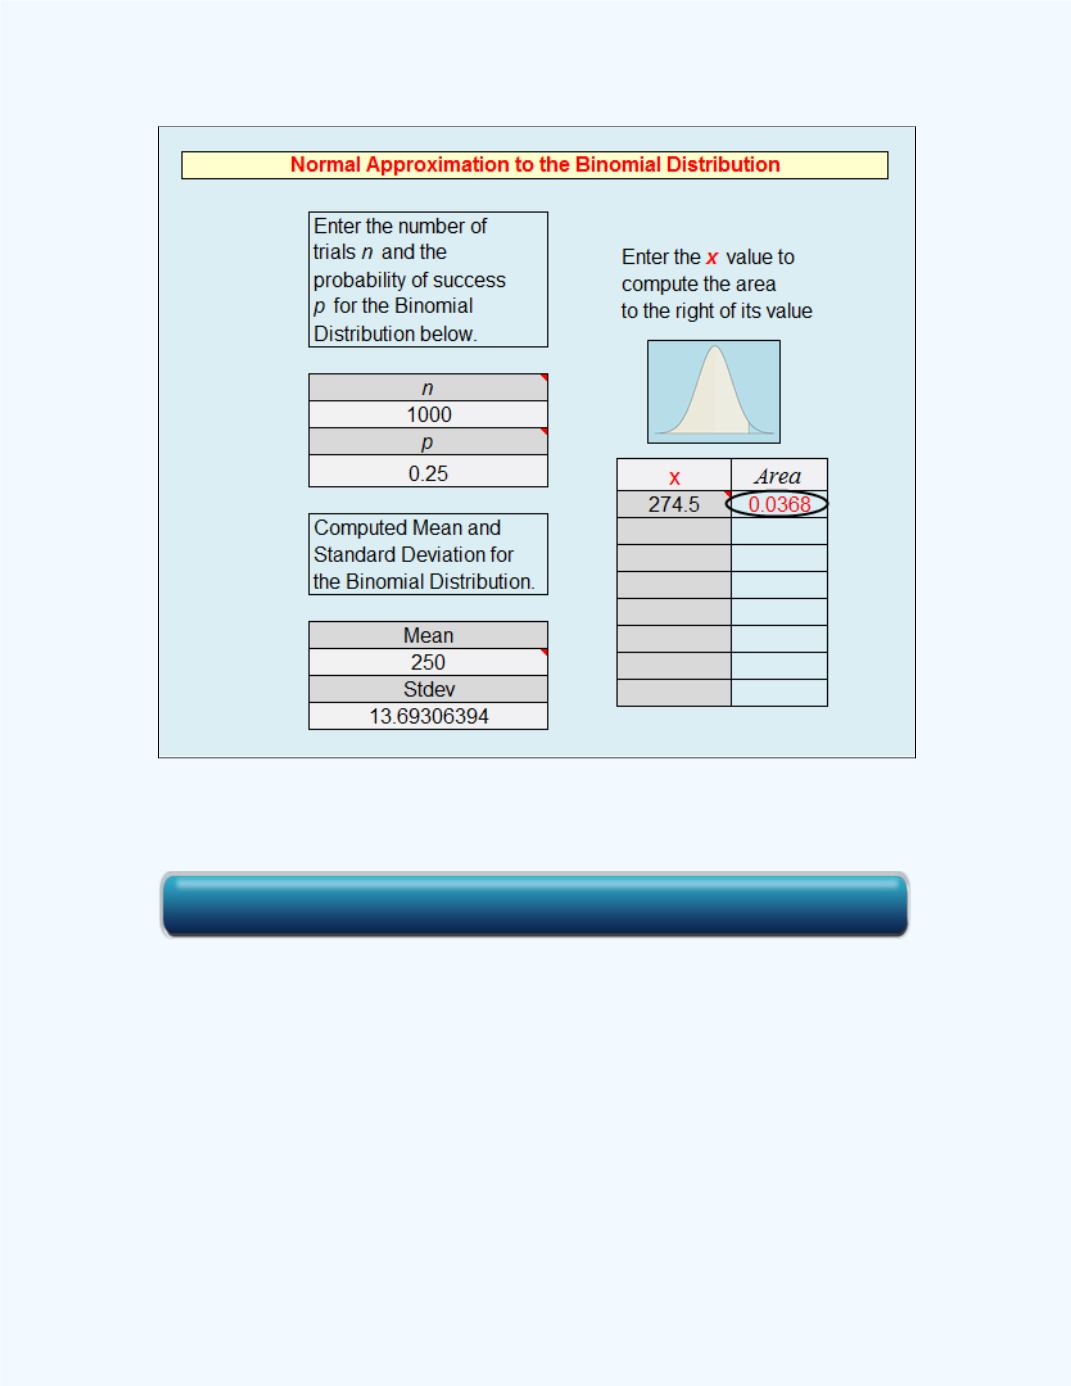
Figure 9-45:
Normal Approximation to the Binomial Probability
For
P
(
X
> 274.5) = 0.0368
Note:
Both workbooks give the same answer.
Example 9-14
:
The following bar chart shown in
Figure 9-46
displays the
defective rates in a production process. Suppose a random sample of 200 of
the finished items is sampled. Find the probability that at most 192 of items
will be classified as non-defective items.
Solution:
Let
X
= number of non-defective items.
Click here for the Normal Approximation to the Binomial Workbook