


 406 / 762

406
Chapter 9: The Normal Probability Distribution
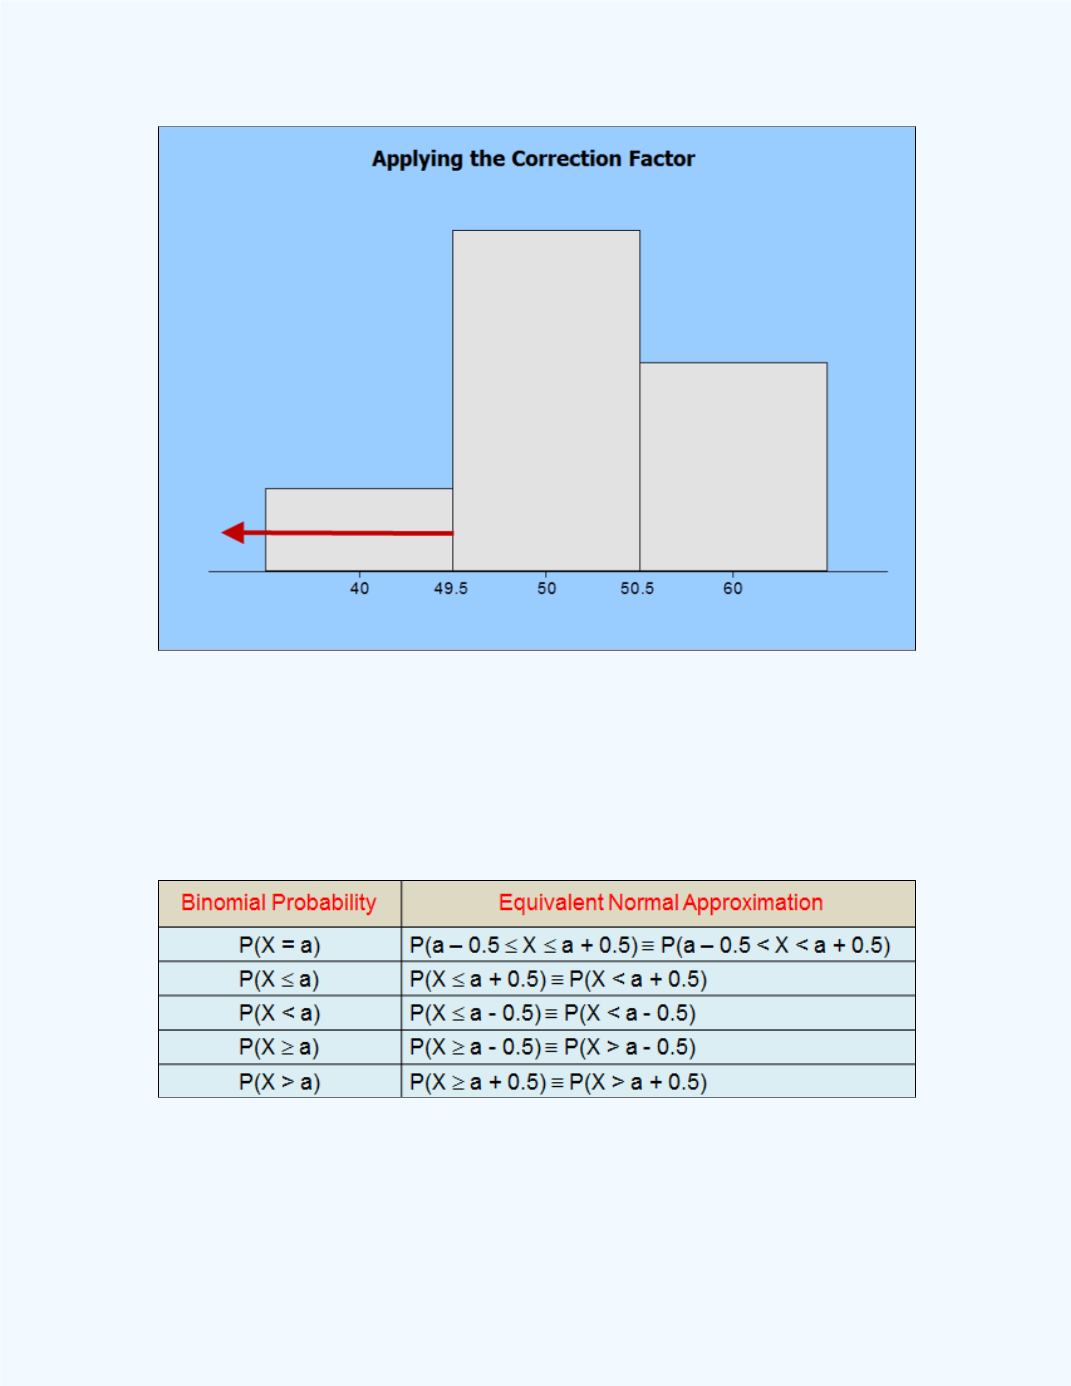
Figure 9-42:
P
(
X
< 50) =
P
(
X
49.5)
Based on the previous examples for a binomial random variable
X
and a
positive integer
a
, where
is the number of trials in a binomial
experiment, we can state the following general normal approximations as
shown in
Figure 9-43
.
Figure 9-43:
Possible Normal Approximations for a Binomial
Random Variable