


 411 / 762

Chapter 9: The Normal Probability Distribution
411
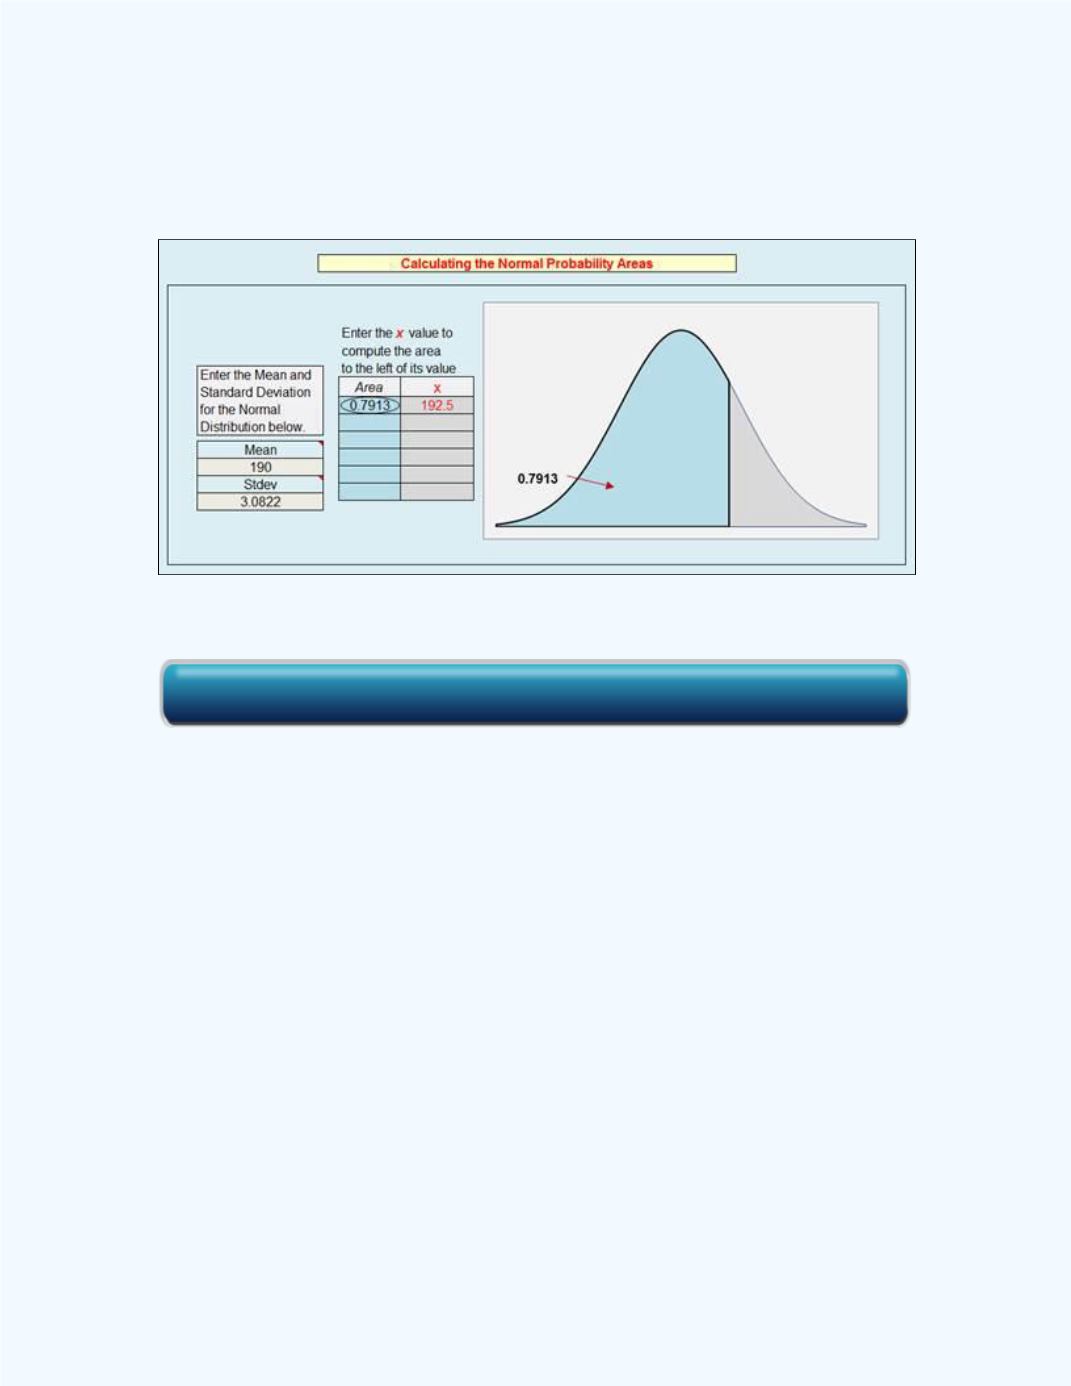
One can now use the
Normal Probability Distribution
workbook with the
computed mean, standard deviation, and
X
= 192.5. The results are shown
in
Figure 9-47
below. Thus
P
(
X
< 192.5) = 0.7913.
Figure 9-47:
Normal Probability for
P
(
X
< 192.5) = 0.7913
Alternatively, one can use the
Normal Approximation to the Binomial
workbook. The results are shown in
Figure 9-48
below.
Click here for the Normal Probability Distribution Workbook