


 532 / 762

532
Chapter 12: Hypothesis Tests – Large Samples
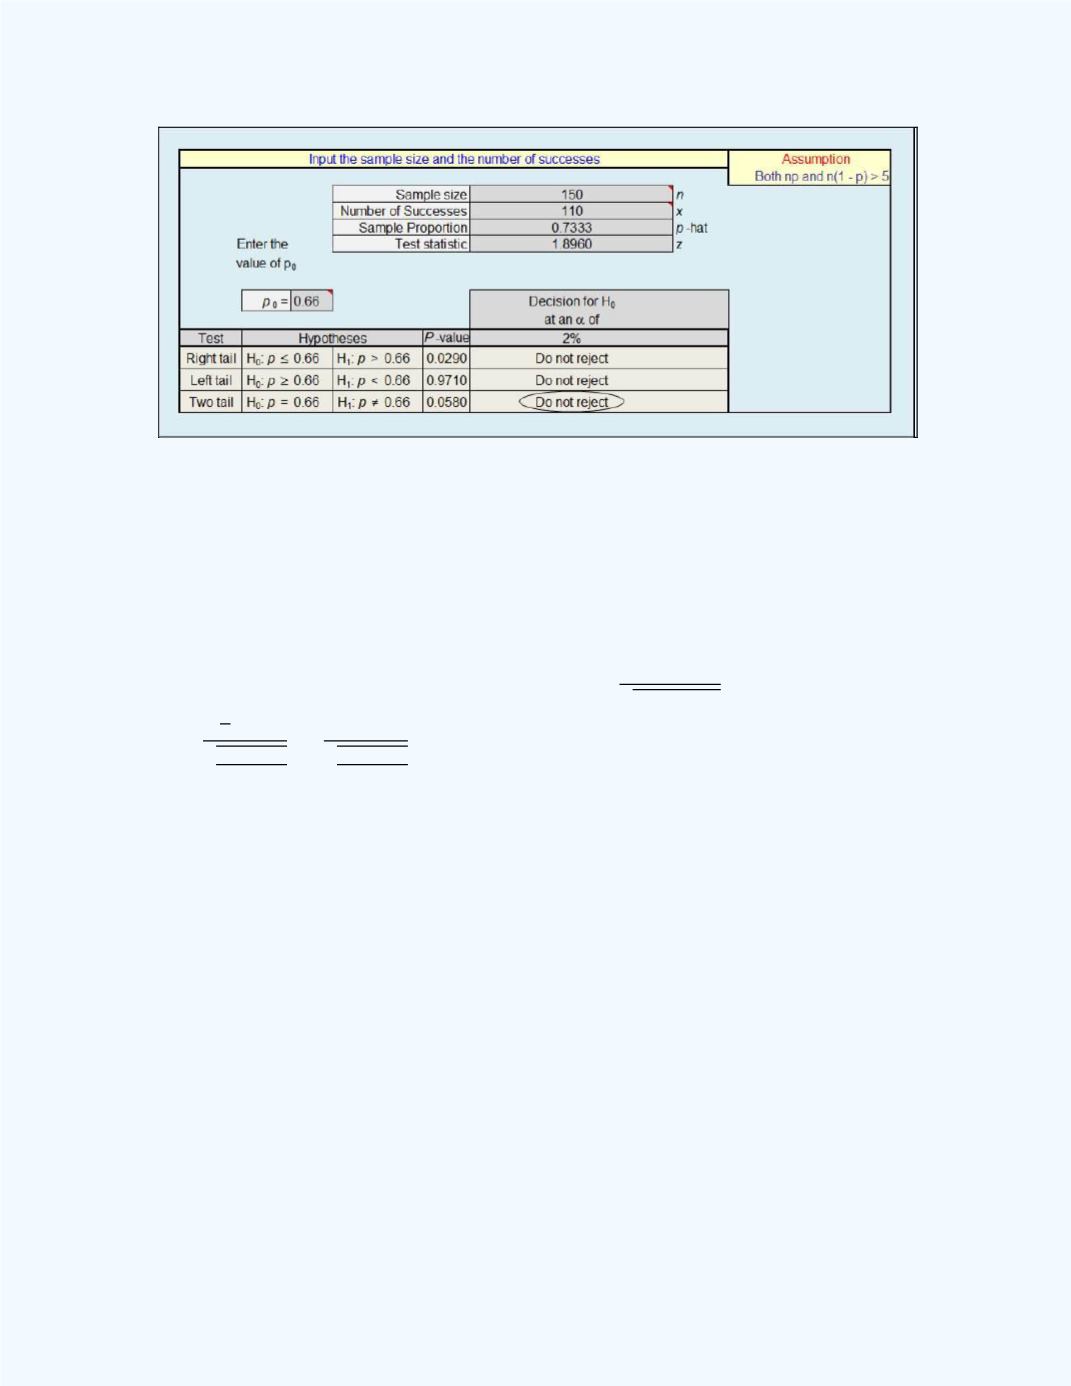
Figure 12- 8:
Display of the Test for a Single Population
Proportion workbook output for
Example 12-4
The output shows that the
P
-value = 0.0580 >
= 0.02 (2%) so the null
hypothesis will not be rejected and one will have the same conclusion as
when the test was done using the classical approach.
Note:
The test statistic in the above tests,
√
is equivalent to
√
̂
√
. Observe that this is similar to the
score
discussed in Chapter 10 when dealing with the sampling distribution for a
population proportion.
Accept/Fail to Reject/Do not Reject
H
0
In hypothesis testing, some authors may use the phrase “accept the null
hypothesis” instead of “fail to reject the null hypothesis” or “do not reject
the null hypothesis.” It does not matter which of the phrases is used when
making a decision about
, one should always keep in mind that we are not
proving the null hypothesis. All that is being inferred is that the sample
evidence is not strong enough to warrant rejection of
. In addition, when
we do not reject the null hypothesis, we may infer that there is not enough or
insufficient sample evidence to conclude that the alternative hypothesis is
true, since, whatever we are trying to conclude about the population is
stipulated in the alternative hypothesis.
Figure 12-9
gives an idea of the
wording of the conclusion in hypothesis testing.