


 538 / 762

538
Chapter 12: Hypothesis Tests – Large Samples
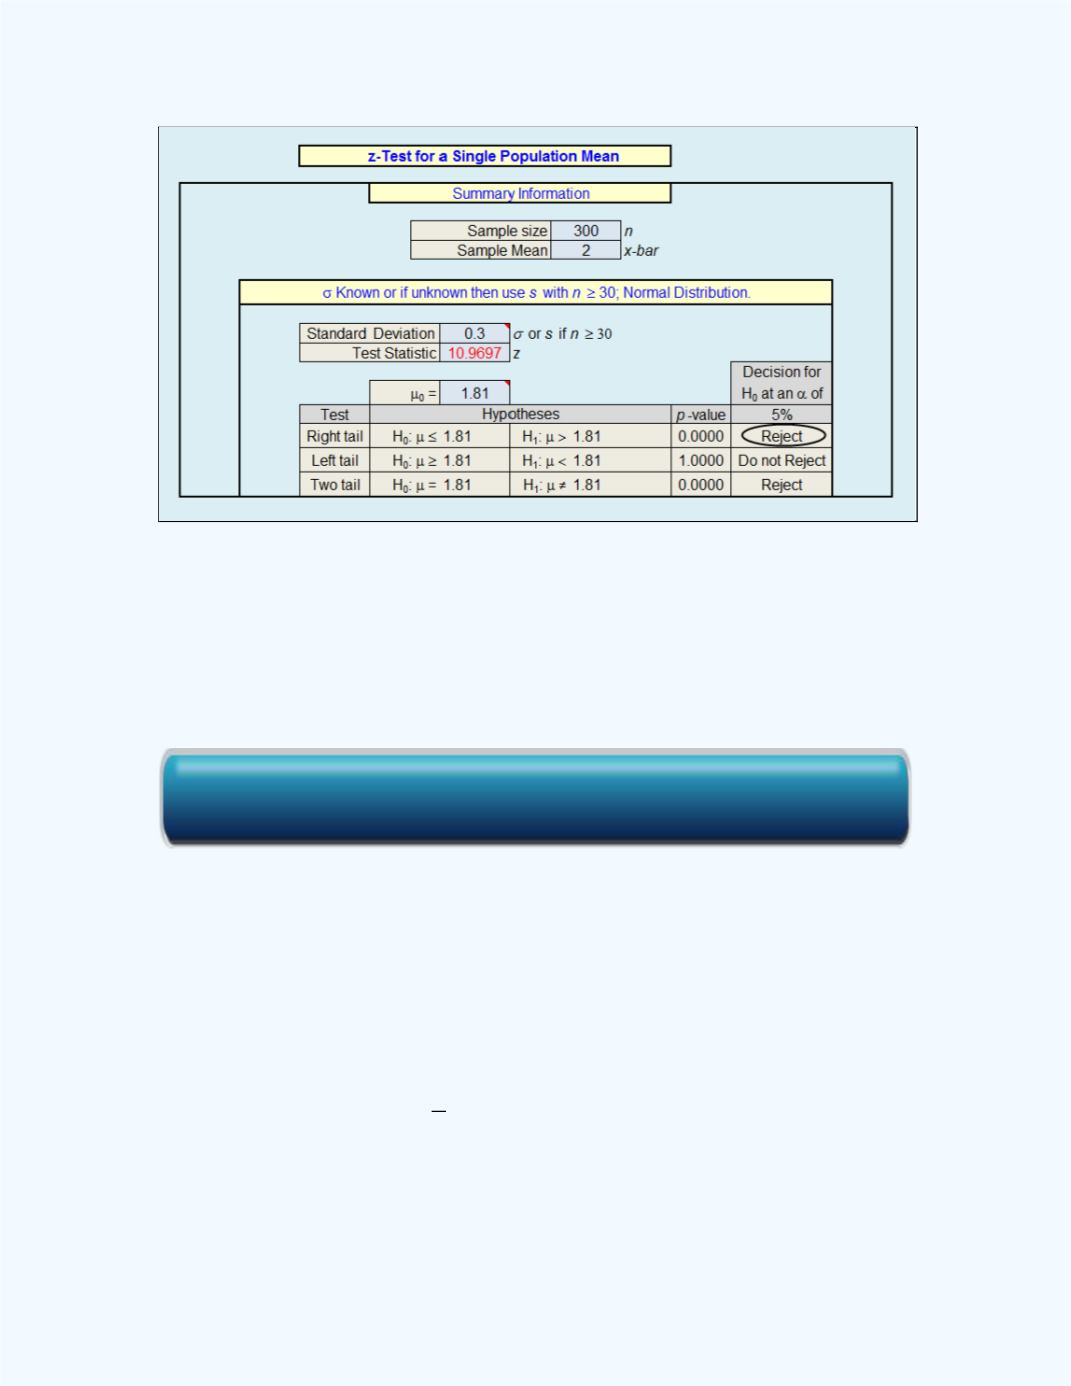
Figure 12- 12:
Display of the Test for a Single Population
Mean workbook output for
Example12-5
The output shows that the
P
-value = 0.0000 <
= 0.05 (5%) so the null
hypothesis will be rejected and one will have the same conclusion as when
the test was done using the classical approach.
Example 12 -6
: Upper management of a large chain-store (A) claims that
the mean salary of their floor managers is greater than that of its
competitor’s (B), which is $66,200. Personnel in upper management from
(A) took a random sample of 75 of their managers’ salaries which yielded a
mean salary of $66,500 with a standard deviation of $1,800. Use the
P
-value
approach to test upper management’s claim at the 5% level of significance.
Summary information:
= 75,
= 1,800,
= 0.05,
̅
= 66,500,
= 1.645,
and
= 66,200. Also,
√ ⁄
= 207.8461.
Since upper management would like to establish that the average salary for
the chain is higher, the alternative hypothesis should reflect this belief.
Click here for the Large Sample Test for a Single Population Mean Workbook