


 543 / 762

Chapter 12: Hypothesis Tests – Large Samples
543
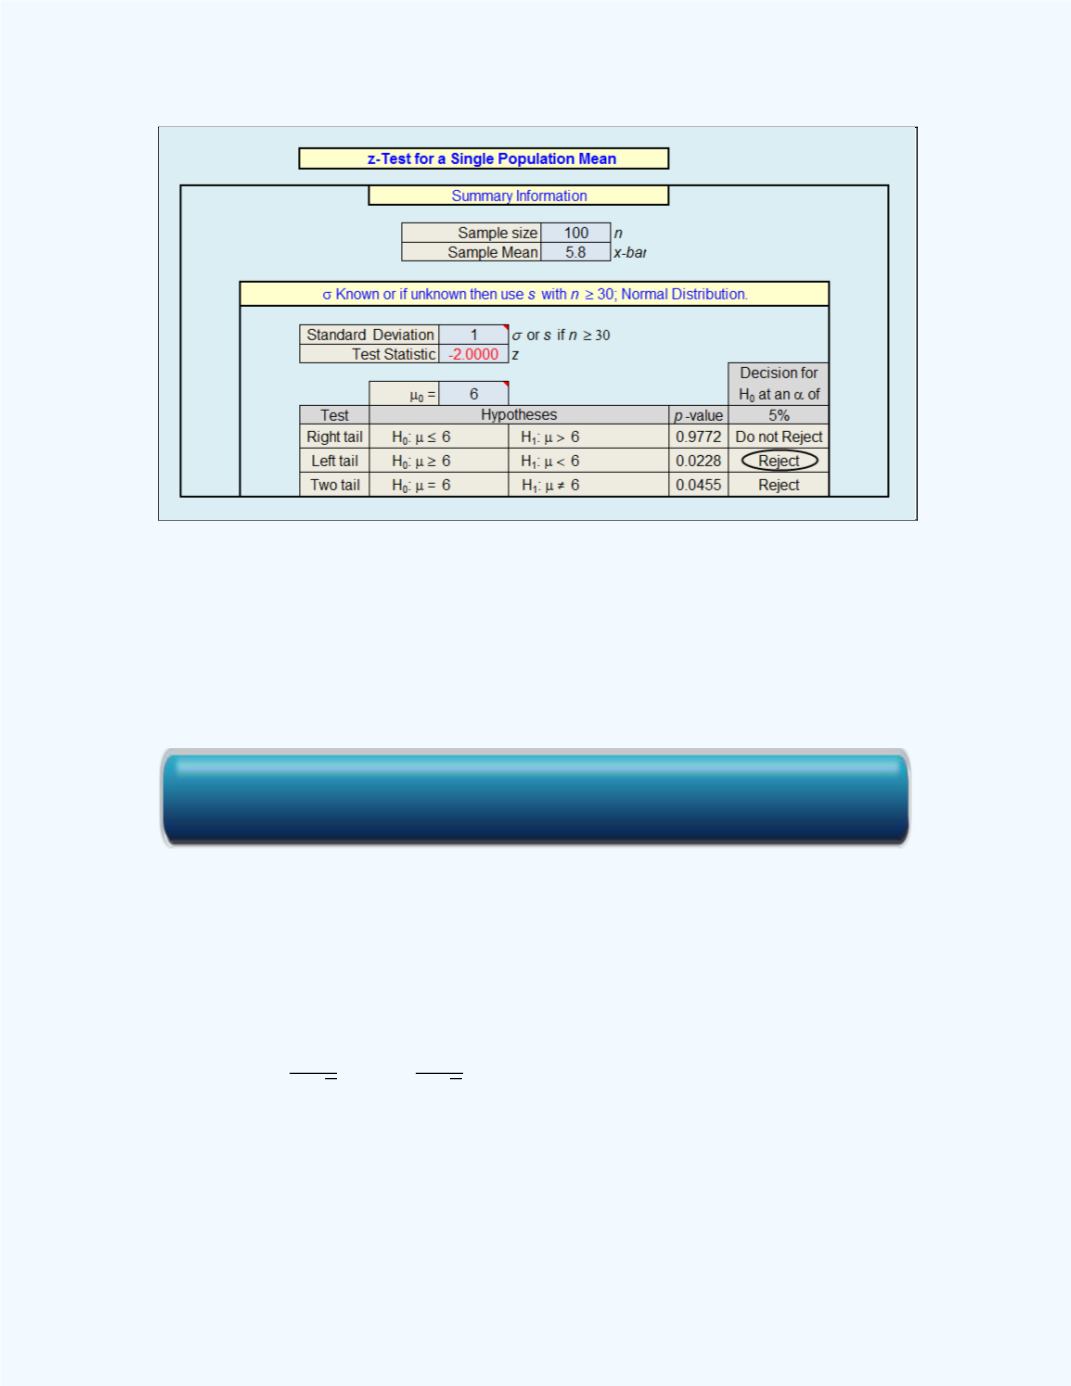
Figure 12- 15:
Display of the Test for a Single Population
Mean workbook output for
Example 12-7
The output shows that the
P
-value = 0.0228 <
= 0.05 (5%) so the null
hypothesis will be rejected and one will have the same conclusion as when
the test was done using the classical approach.
(c) Two –tailed Test
(where
is a specified proportion value)
:
̅
√ ⁄
or
̅
√ ⁄
for
unknown and
30
: For a specified significance level
, reject the null hypothesis if
the computed test statistic value
-
or if
(this is
equivalent to
| |
).
Click here for the Large Sample Test for a Single Population Mean Workbook