


 548 / 762

548
Chapter 12: Hypothesis Tests – Large Samples
approach a normal distribution. Recall from
Chapter 10
, the distribution of
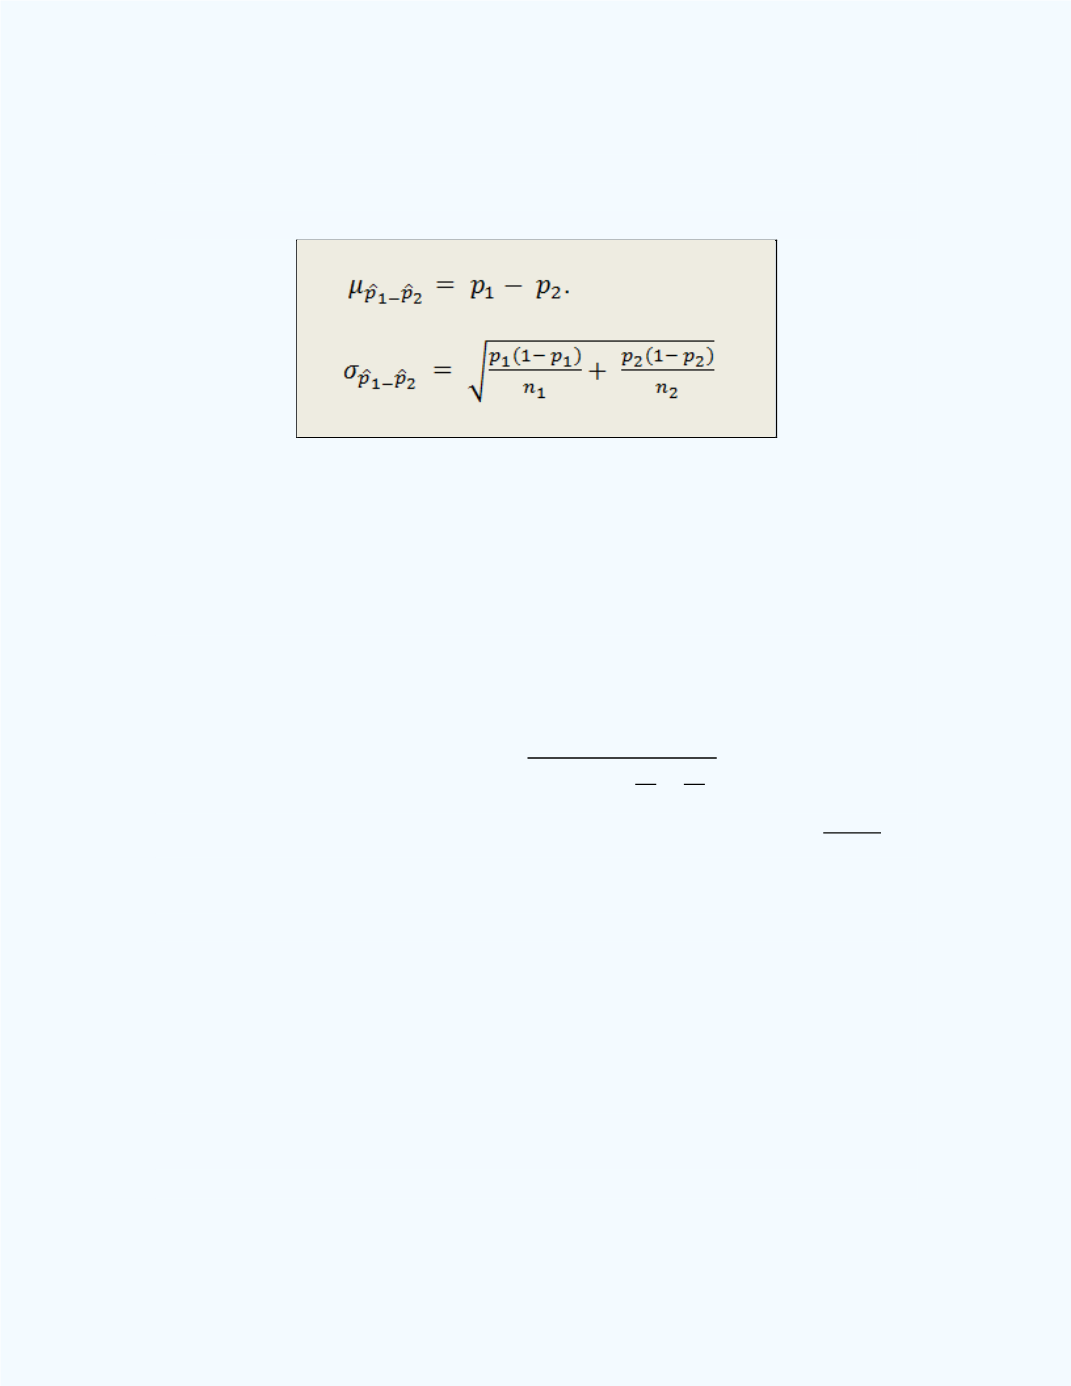
the differences of the sample proportions will have the following mean and
standard deviation given in
Figure 12-19
.
Figure 12- 19:
The Mean and Standard Deviation for the
Distribution of the DifferenceBetween Two
Sample Proportions
Recall that when we perform hypothesis tests, the null hypothesis is assumed
to be true during the process. The process decides whether this assumption
should be rejected or not. When we test the null hypothesis
against
an appropriate alternative hypothesis, we can let
where
is
some constant between 0 and 1 and is usually referred to as the pooled
proportion. With this in mind, the mean
̂
̂
-
will be zero and
the standard error can be written as
√ (
)
. Since the value of
pooled proportion
is unknown, we can estimate the value by
̂
.
Following is a summary of the tests for the difference between two
population proportions using the above information.
Summary of Hypothesis Tests
(a) Right –tailed (one-tailed) Test
:
: