


 554 / 762

554
Chapter 12: Hypothesis Tests – Large Samples
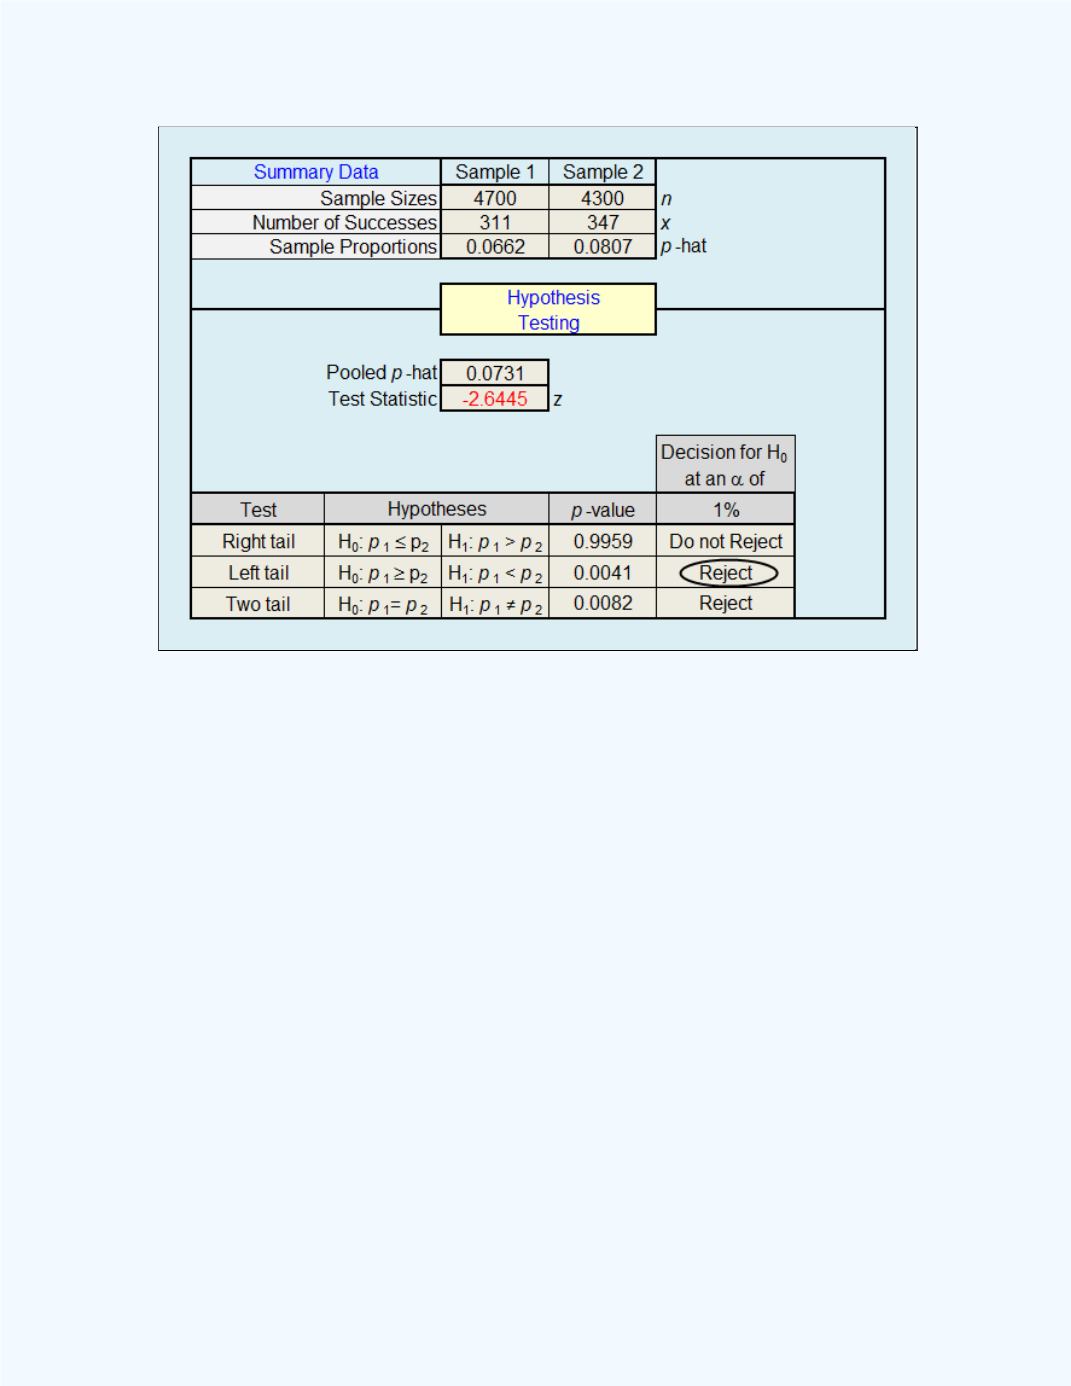
Figure 12- 22:
Display of the Large Sample Test for the Difference
Between Two Population Proportions workbook
output for
Example 12-10
Solution:
:
(
)
:
(
)
P
-value = 0.0041 (from
Figure 12-22
)
D.R
: For a significance level
= 0.01, reject the null hypothesis if the
computed
P
-value = 0.0041 <
= 0.01.
Conclusion
:
Since 0.0041 < 0.01, reject
. There is sufficient sample
evidence to conclude that the proportion of patients who did not meet the
cholesterol target level using medication A is less than the proportion for
those who used medication B at the 1% level of significance.