


 560 / 762

560
Chapter 12: Hypothesis Tests – Large Samples
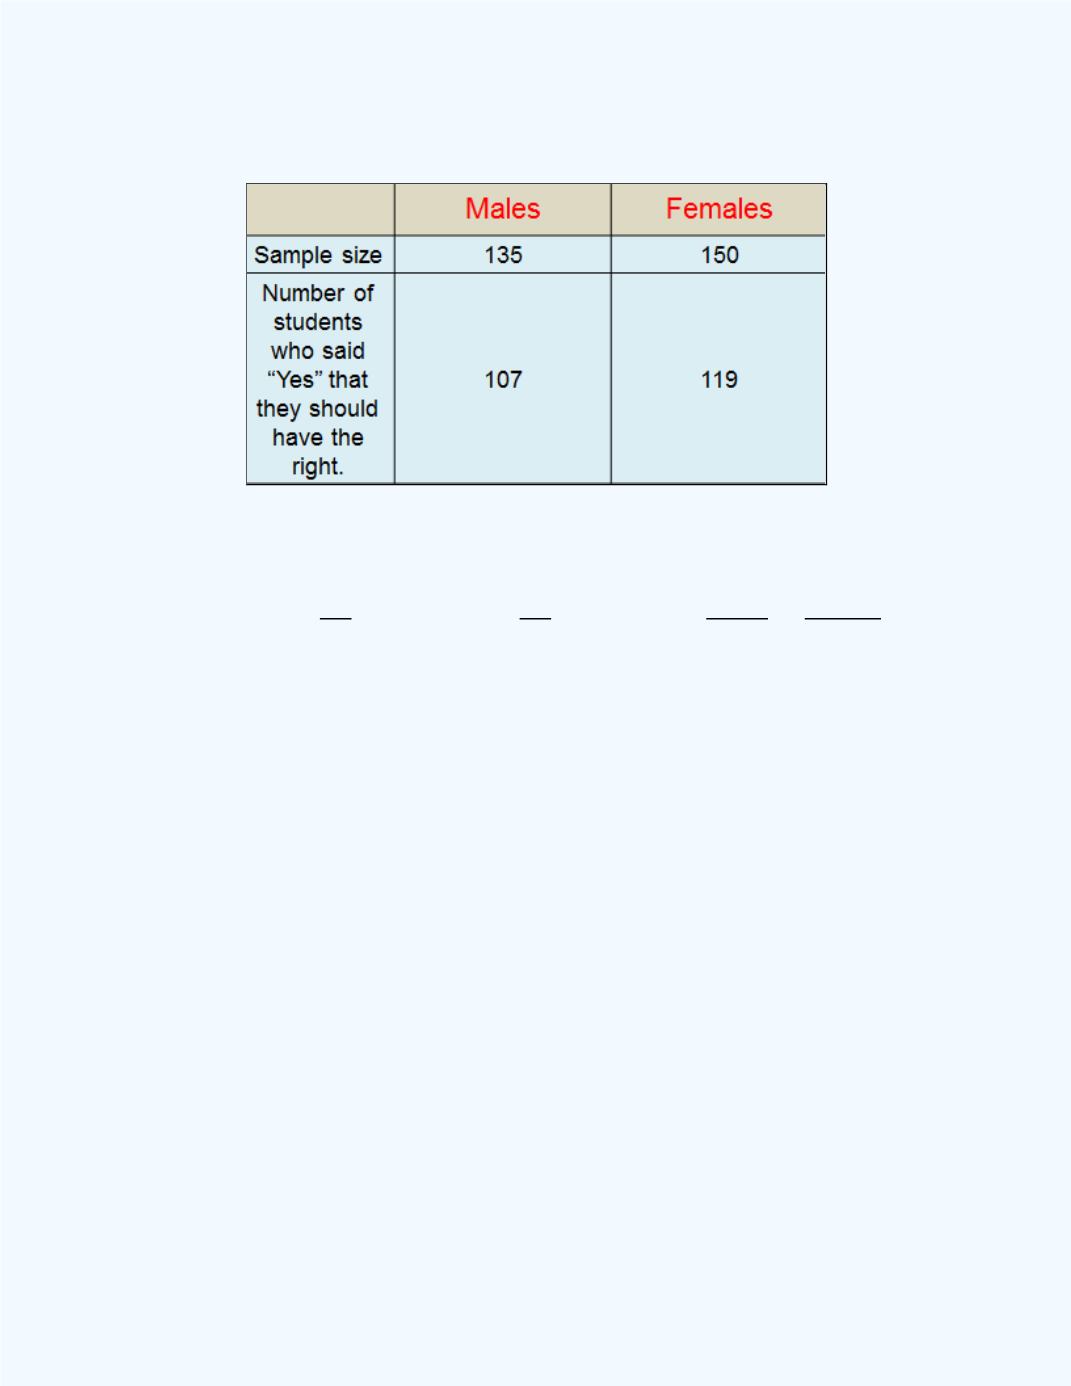
Table 12-5:
Sample data for
Example 12-12
Use the
P
-value approach to test at the 1 percent level of significance.
Summary information
: From the information given, we have
= 135,
= 150,
̂
= 0.7926,
̂
= 0.7933,
̂
=
0.7930, and
= 0.01.
Figure 12-25
shows the
Large Sample Test for the
Difference BetweenTwo PopulationProportions
workbook output for
Example 12-12
.
Solution:
This is a two-tail test since we are just testing whether there is a difference
or not.