


 563 / 762

Chapter 12: Hypothesis Tests – Large Samples
563
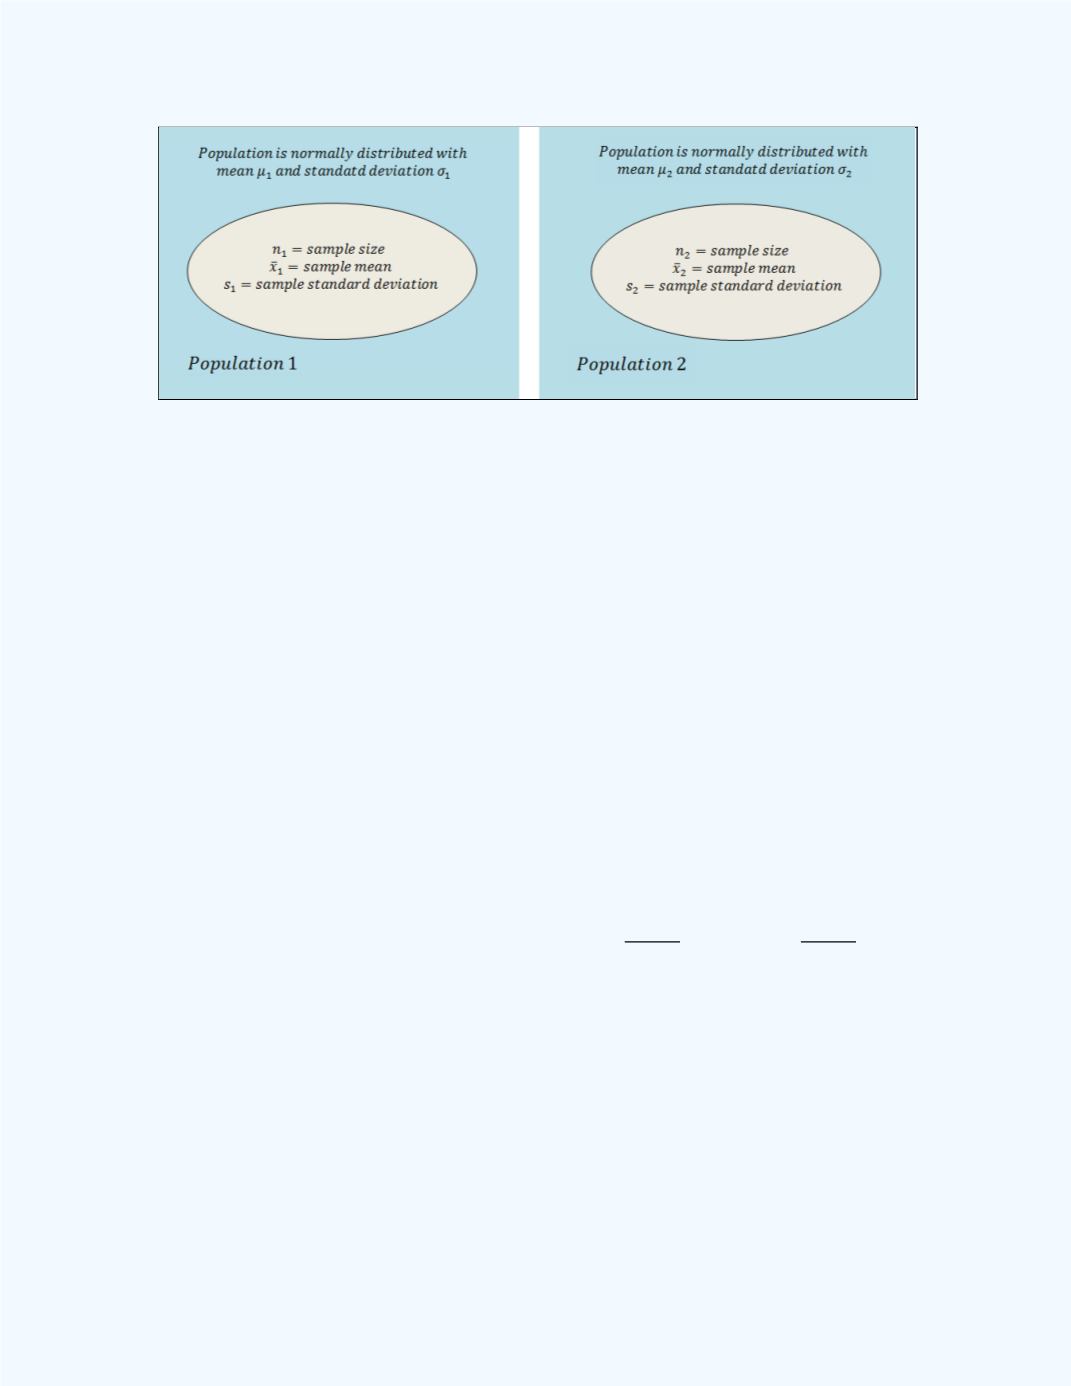
Figure 12- 26:
Experimental Display for Sampling from
The two populations with respective means
1
and
2
Assumptions:
We will assume that the populations are normally distributed.
We will assume that the population standard deviations are known.
If the populations are not normally distributed and the standard
deviations are unknown, then, both
n
1
and
n
2
must be greater than (>)
30.
Since we will be testing for the difference between two population means,
we first will establish properties of the sampling distribution for the
difference between the two sample means. The point estimate for the
difference between the two population means is the difference between the
two sample means. So if
and
are the respective population means and
we let
̅
and
̅
to be the corresponding sample means, then the point
estimate for
-
will be
̅
-
̅
where
̅
∑
and
̅
∑
Observe from
Figure 12-26
that independent samples of sizes
and
are
selected from the populations.
Now as the sample sizes
and
increase, the shape of the distribution of
the differences of the sample means obtained from any population will
approach a normal distribution. Recall from
Chapter 10
, the distribution of
the differences of the sample means will have the following mean and
standard deviation given in
Figure 12-27
.