


 558 / 762

558
Chapter 12: Hypothesis Tests – Large Samples
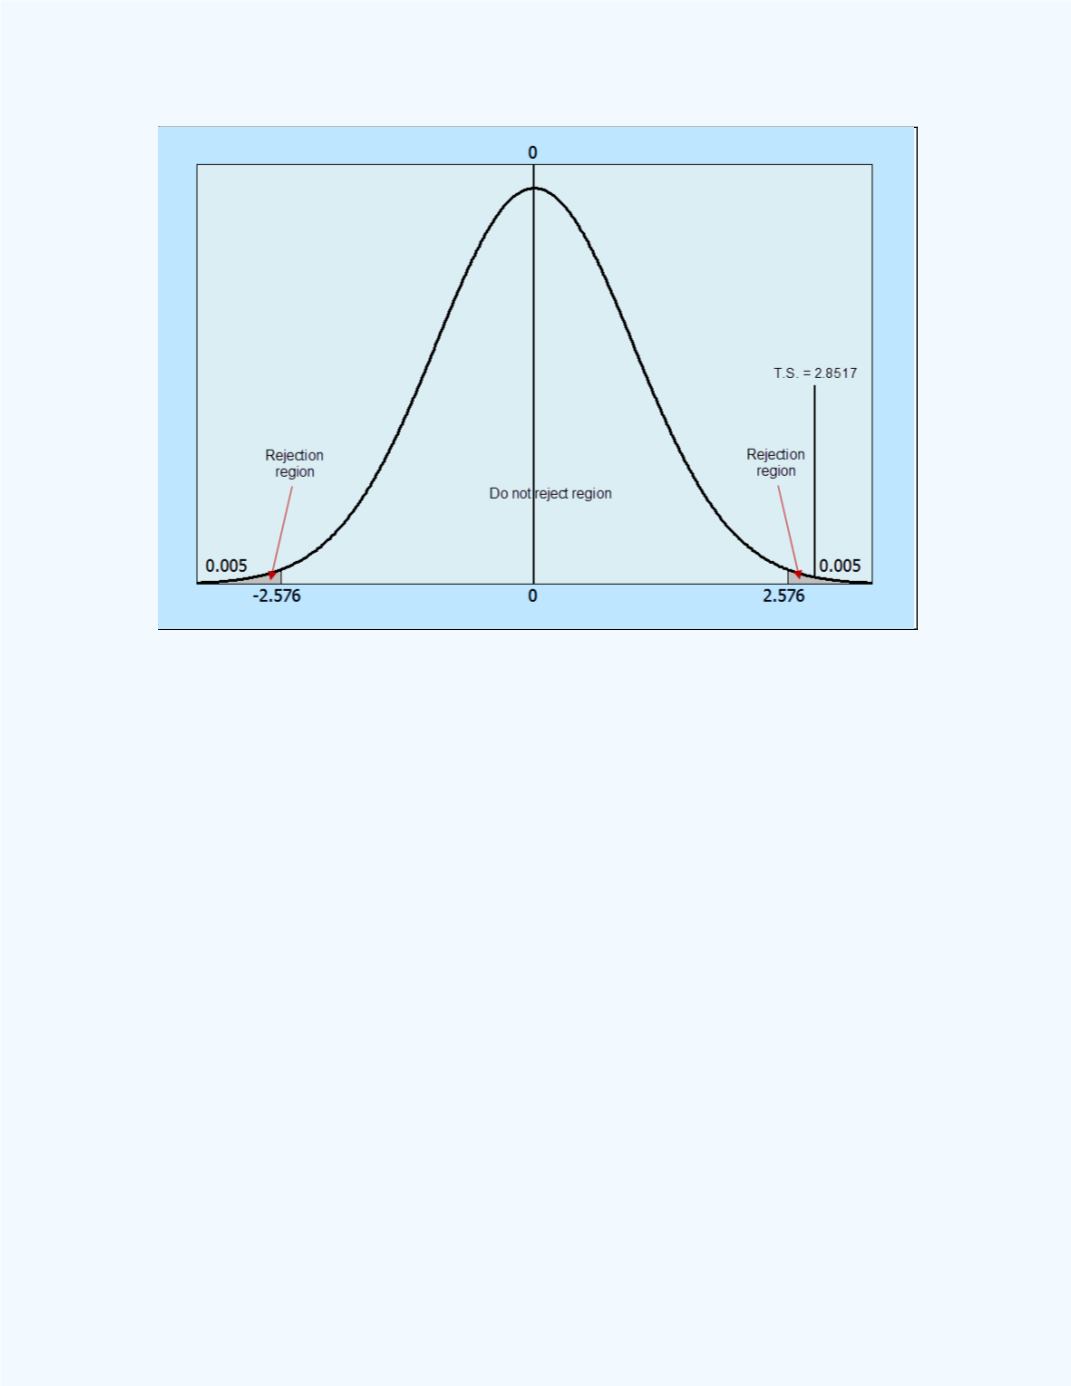
Figure 12-23:
Display of the test statistic in relation to the
rejection region for
Example 12-11
The output is given in
Figure 12-24.
It shows that the
P
-value = 0.0044
<
= 0.01 (1%) so the null hypothesis will be rejected and one will have
the same conclusion as when the classical approachwas used.