


 556 / 762

556
Chapter 12: Hypothesis Tests – Large Samples
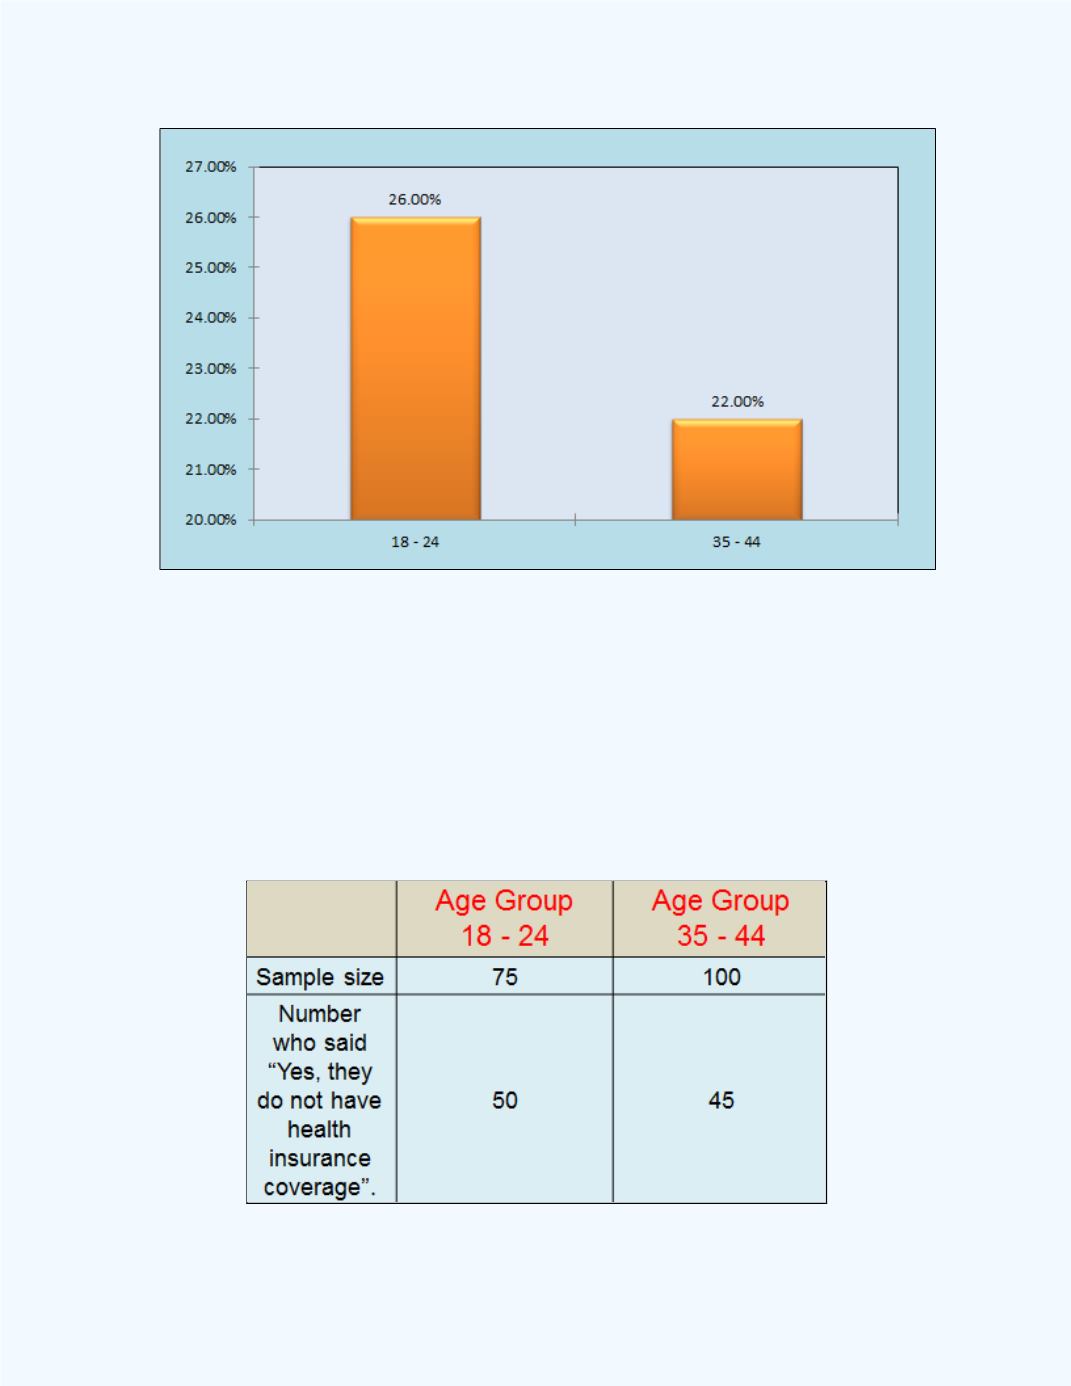
A graduate student viewed this graphic and was curious as to whether there
was a significant difference between the proportions of uninsured for the 18
– 24 age group and the 35 – 44 age group. Her curiosity was flamed from
the fact that the current Affordable Health Care Act allows parents to keep
their children on their health care plans until the child (children) reaches
(reach) 26 years of age.
Table 12-4
shows the results of the study done by
the graduate student.
Table 12-4:
Data for
Example12-11
Test at the 1% significance level.