


 551 / 762

Chapter 12: Hypothesis Tests – Large Samples
551
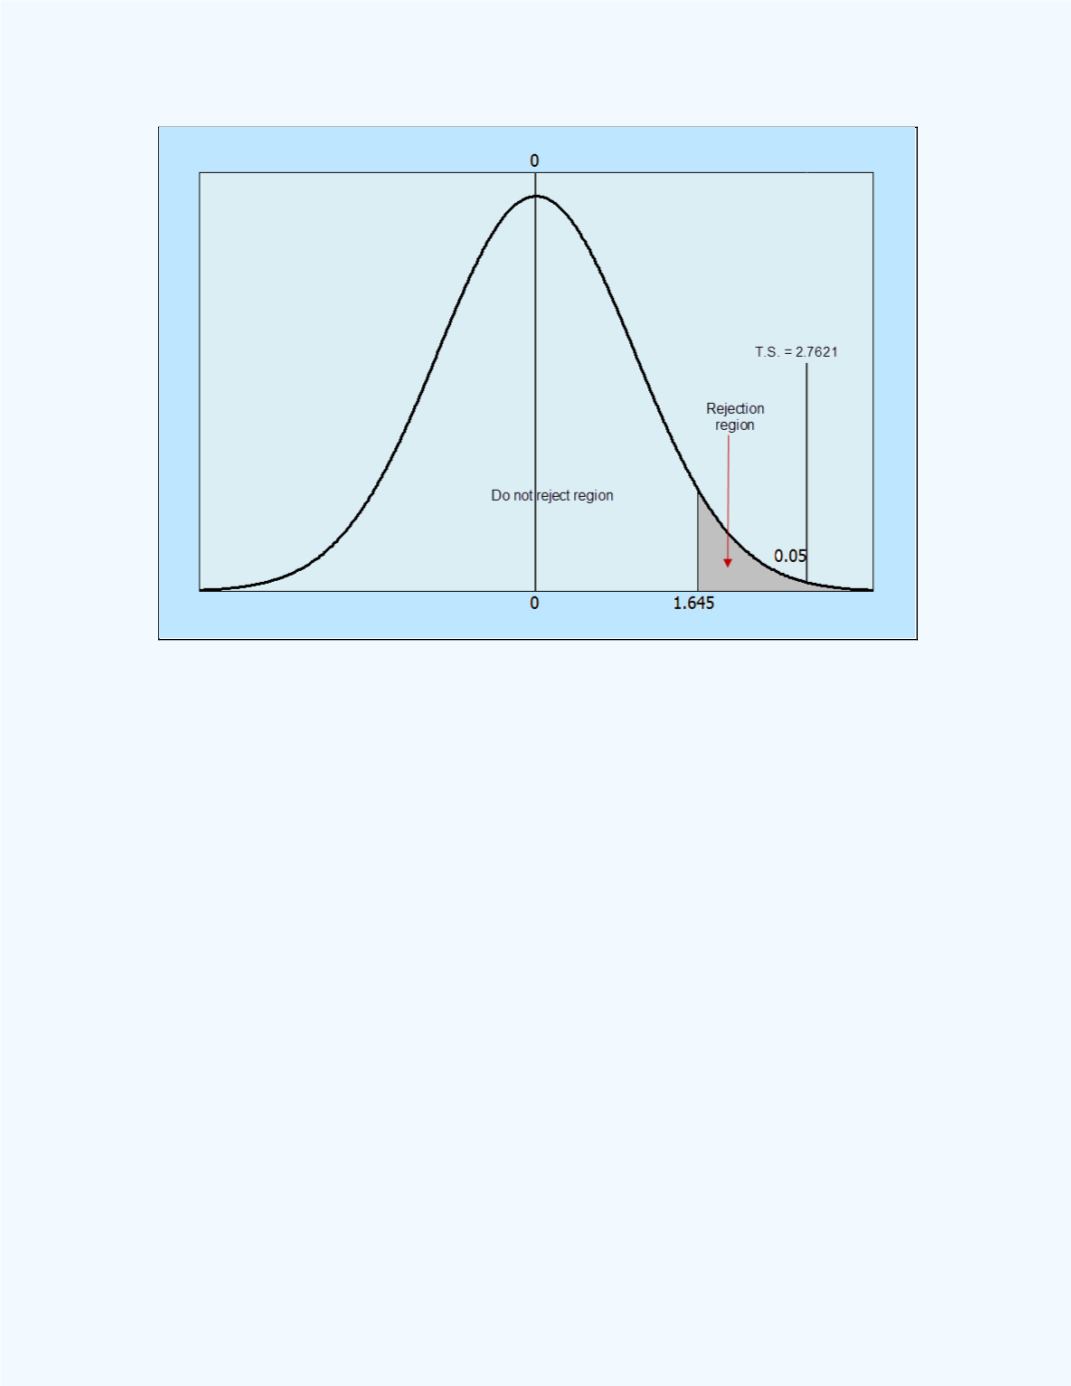
Figure 12-20:
Display of the test statistic in relation to the
rejection region for
Example 12-9
Note:
We can also use the
Large Sample Test for the Difference
BetweenTwo PopulationProportions
workbook to help with the
computation for this example.
The output is given in
Figure 12-21
. It shows that the
P
-value = 0.0029
<
= 0.05 (5%) so the null hypothesis will be rejected and one will have
the same conclusion as when the classical approachwas used.