


 553 / 762

Chapter 12: Hypothesis Tests – Large Samples
553
Conclusion
: ……….
Note:
This is a left-tailed test because the direction of the inequality sign in
the alternative hypothesis is to the left.
Example 12-10
:
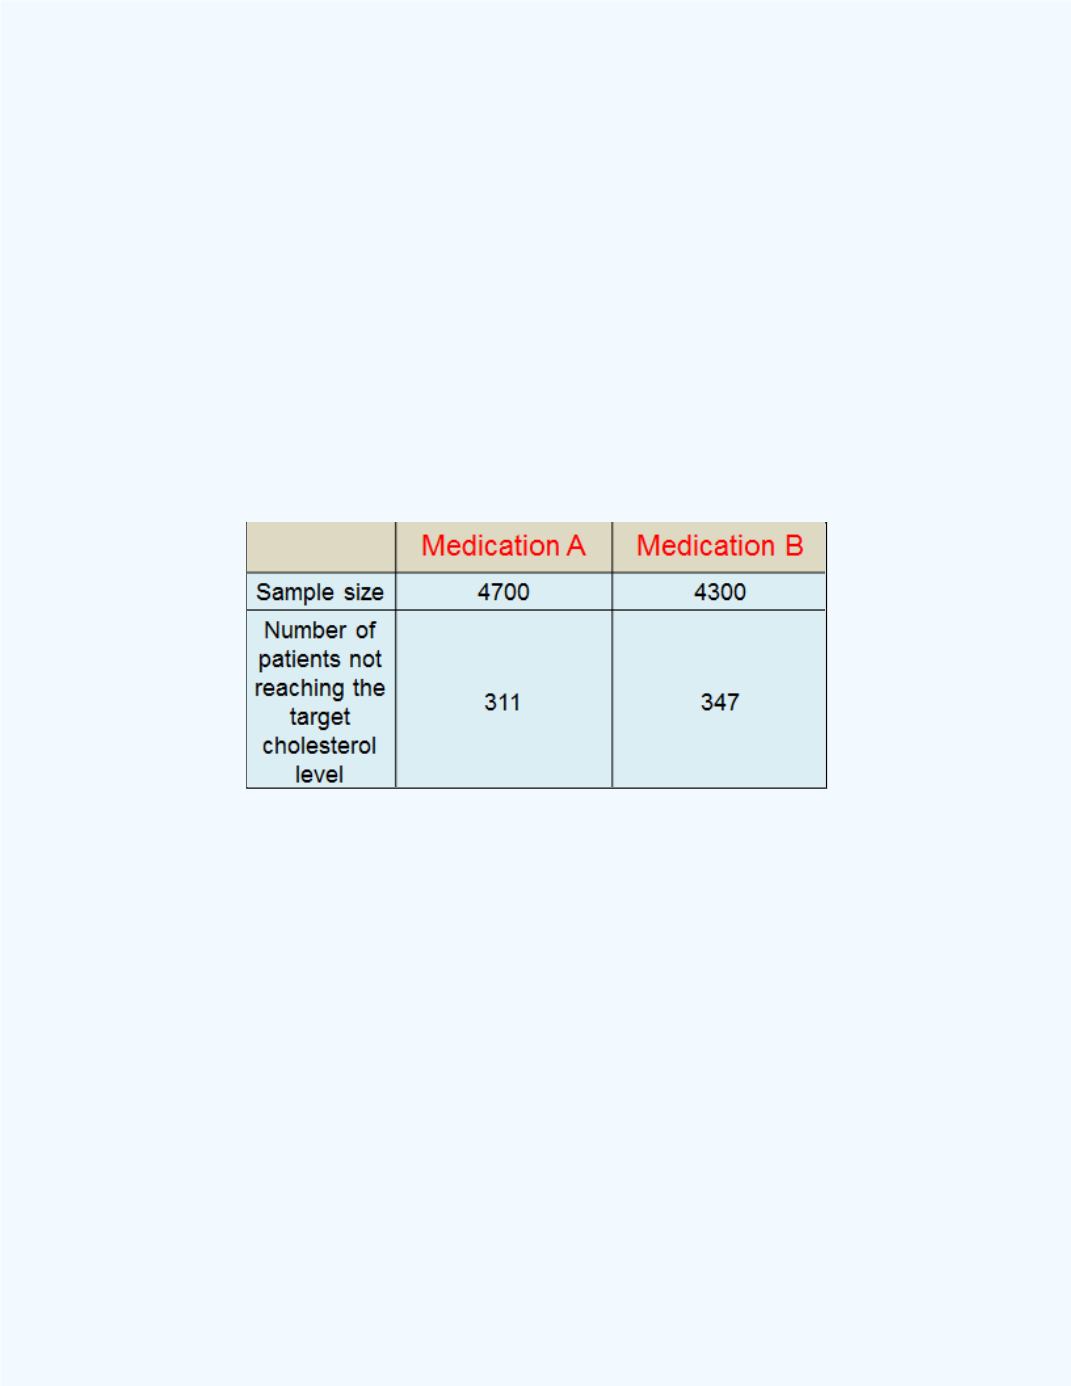
Amedical study was conducted to determine the effect of
two cholesterol reducing medications, denoted by A and B. At the end of
the study, the number of people who did not meet the target cholesterol level
in each sample group was recorded.
Table 12-3
shows the results of a study.
Table 12-3:
Data for
Example12-10
Use the
P
-value approach to test, at the 1% level of significance, to
determine whether medication A was less effective in reducing the
cholesterol levels.
Summary information
:
Let
be the proportion of patients who did not
meet the cholesterol target level using medication A. Let
be the
proportion of patients who did not meet the cholesterol target level using
medication B.
Since we are asked to use the
P
-value approach to test the hypothesis, we
will first use the
Large Sample Test for the Difference BetweenTwo
Population Proportions
workbook to perform the computations.
Figure
12-22
shows the results for the given information.