


 561 / 762

Chapter 12: Hypothesis Tests – Large Samples
561
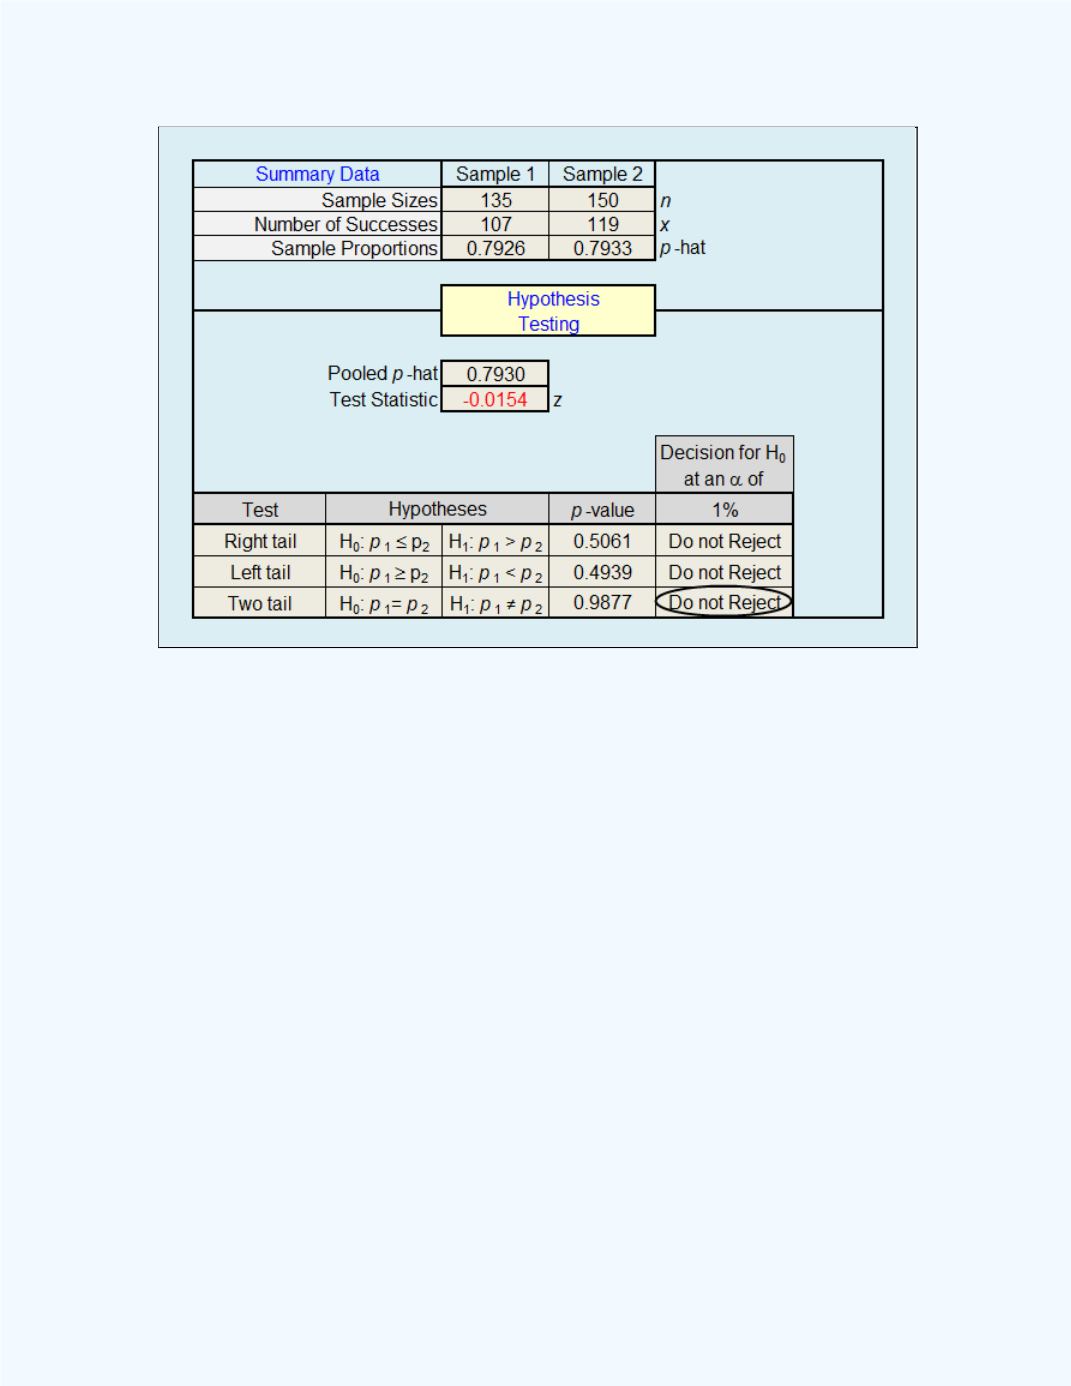
Figure 12- 25:
Display of the Large Sample Test for the Difference
Between Two Population Proportions workbook
output for
Example 12-12
Since this is a two-tailed test as mentioned above, so using the
P
-value
approach, we have
:
(
)
:
(
)
P
-value = 0.9877
D.R:
For a significance level
= 0.01, reject the null hypothesis if
P
-value = 0.9877 <
=
0.01.
Conclusion
:
Since 0.9877 > 0.01, then the null hypothesis
will not be
rejected. There is insufficient sample evidence to conclude that the
proportions are different. That is, we can conclude, at the 1 percent level of
significance, that the proportions of male and female students who believe