


 569 / 762

Chapter 12: Hypothesis Tests – Large Samples
569
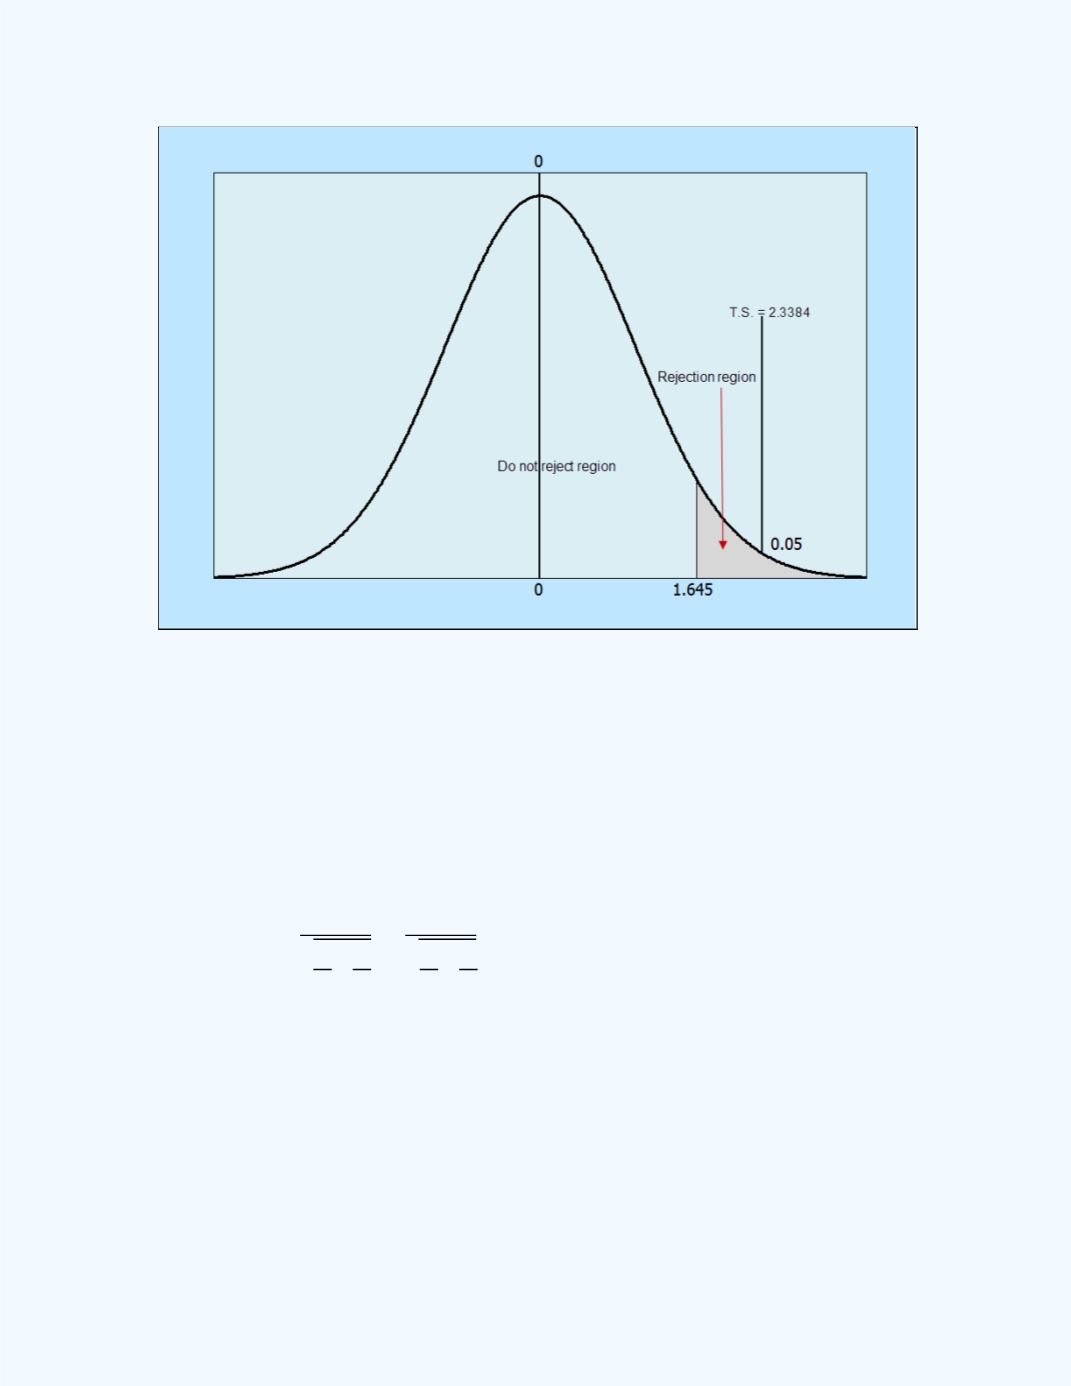
Figure 12-29:
Display of the test statistic in relation to the
rejection region for
Example 12-13
(b) One-tailed (left-tailed
)
:
:
̅
̅
√
or
̅
̅
√
for
30 and
30
D.R
: For a specified significance level
, reject the null hypothesis if
the computed test statistic value
z
is less than -
.
Conclusion
: ……….
Note:
This is a left-tailed test because the direction of the inequality sign in
the alternative hypothesis is to the left.