


 570 / 762

570
Chapter 12: Hypothesis Tests – Large Samples
Example 12-14
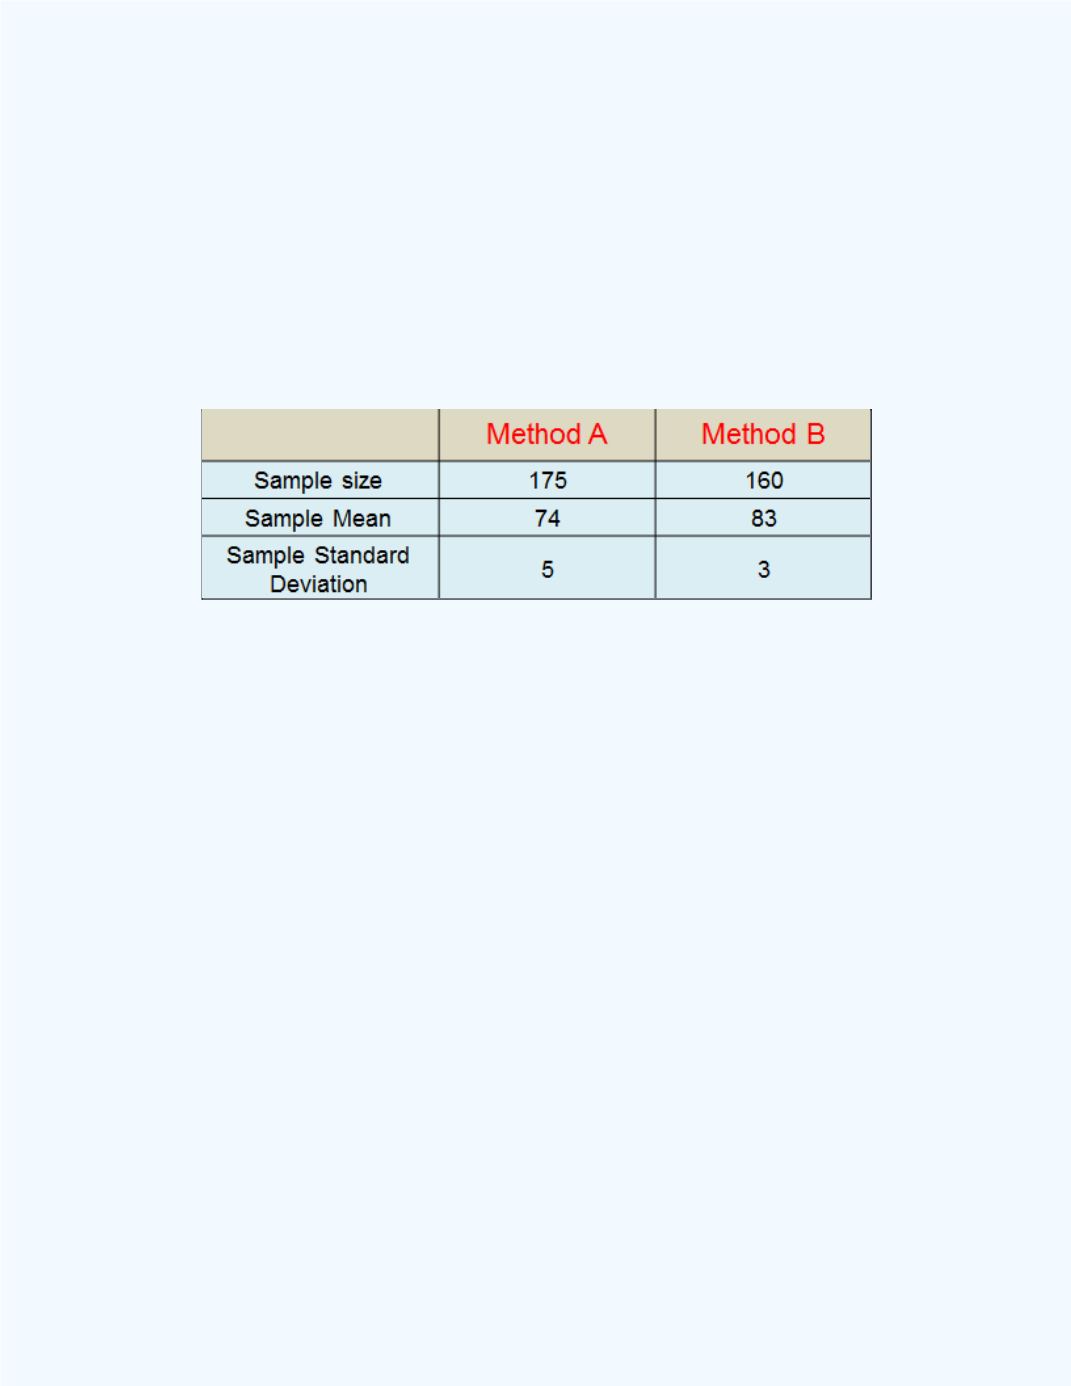
: Two methods were used to teach an elementary statistics
course. A sample of 175 scores was selected for method A, and a sample of
160 scores was selected for method B.
Table 12-7
shows the summary
results of the study done by the researcher for the samples.
Assume that the distributions of the scores for bothmethods are normally
distributed.
Table 12-7:
Data for
Example 12-14
Test at the 5% significance level to determine whether Method A was less
effective than Method B. Use the
P
-value approach.
Summary information
:
Let
be equal to the population average of the
test scores using Method A. Let
be equal to the population average of the
test scores using Method B. Since the distributions for both groups of test
scores are assumed to be normally distributed and both sample sizes are
greater than 30, then we can apply the large sample z-test.
Also, since we are asked to use the
P
-value approach to test the hypothesis,
we will first use the
Large Sample Test for the Difference BetweenTwo
PopulationMeans
workbook to perform the computations.
Figure 12-30
shows the results for the given information.