


 576 / 762

576
Chapter 12: Hypothesis Tests – Large Samples
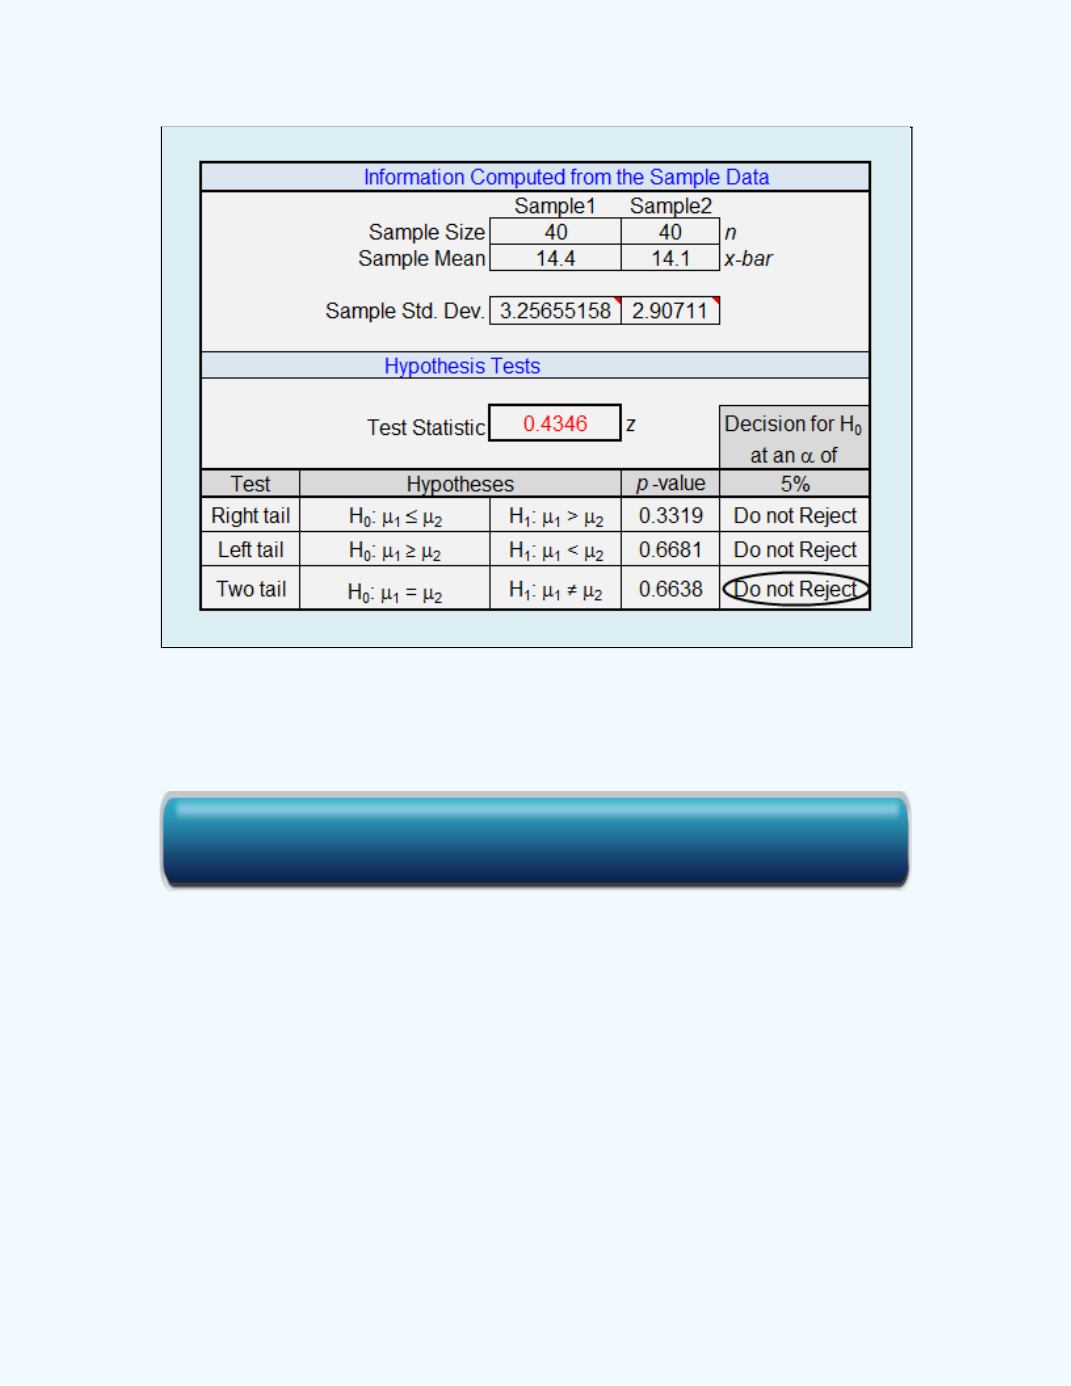
Figure 12- 33:
Display of the Large Sample Test for the
Difference BetweenTwo Population Means
Workbook for
Example 12-16
Thus, using the
P
-value approach to perform the hypothesis test, we have
:
(
= 0)
:
(
0)
P
-value = 0.6638 (from
Figure 12-33
)
: For a significance level
= 0.05, reject the null hypothesis if the
computed
P
-value = 0.6638 <
= 0.05.
Click here for the Large Sample Test for the Difference Between Two Population Means Workbook