


 577 / 762

Chapter 12: Hypothesis Tests – Large Samples
577
Conclusion
:
Since 0.6638 > 0.05, do not reject the null hypothesis. That is,
there is not a significant difference between the average times at the 5%
level of significance. That is, both medications seem to have similar effect
in reducing the pain level of the headache and so neither one of them would
have an advantage in reducing the pain level to zero
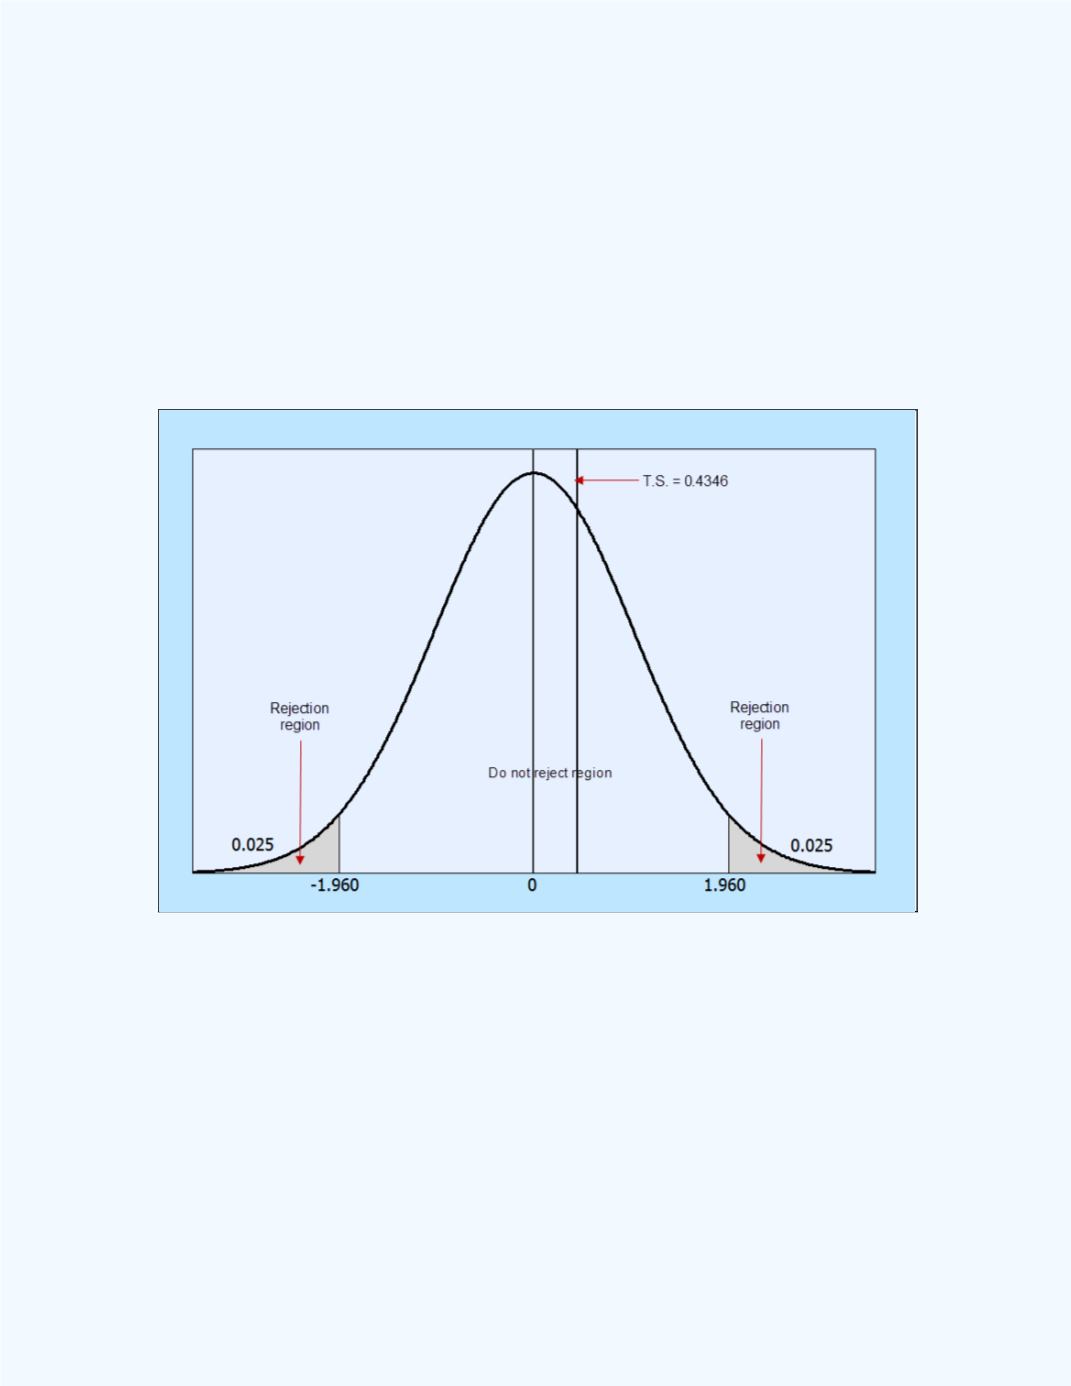
Figure 12-34
shows the rejection region in relation to the computed
-test
statistic value. Note that the
P
-value of 0.6638 will be twice the area to the
right of the
z
test statistic value of 0.4346.
Figure 12-34:
Display of the test statistic in relation to the
rejection region for
Example 12-16
Recall from
Chapter 11
that we can also use the confidence interval to
make a decision. In this case, we will have to make a decision on the null
hypothesis,
.
Figure 12-35
shows the 95% confidence interval for the
difference of the two population means using the data in
Example 12-16
.
Observe that the 95% confidence interval (we are allowing for a 5% error)
for the difference of the two population means is -1.0528 to 1.6528 to four
decimal places.