


 575 / 762

Chapter 12: Hypothesis Tests – Large Samples
575
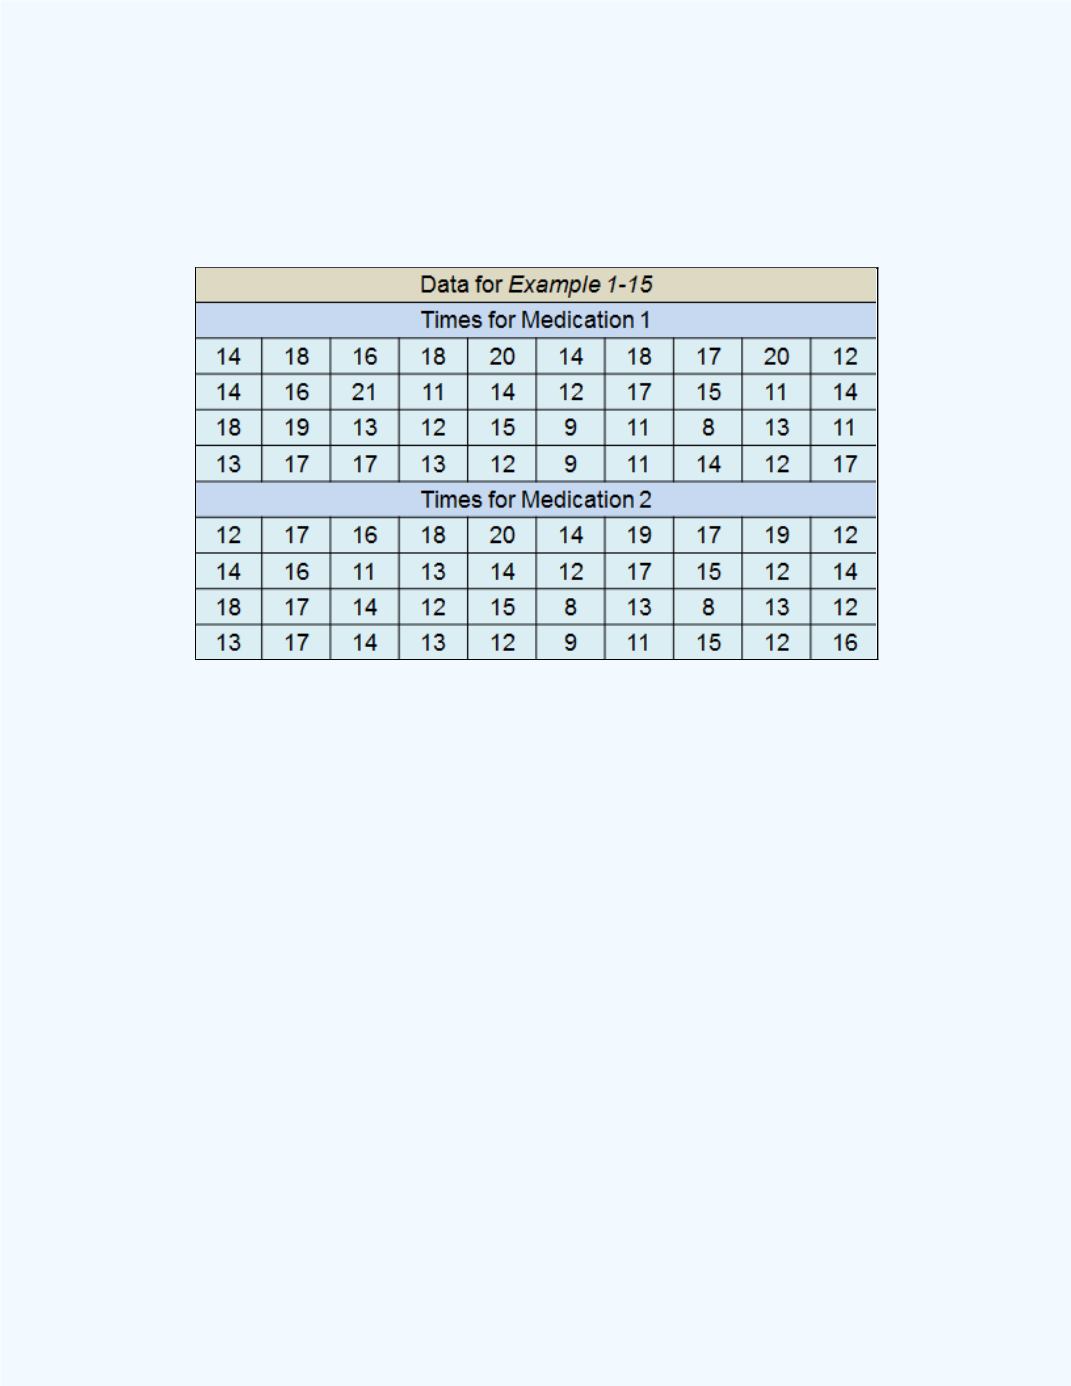
both. The time it took for the pain level to reduce to zero (no headache)
were recorded. The data is given in
Table 12-8
.
Table 12-8:
Data for
Example 12-15
Use the data to test at the 5% significance level whether there was a
significant difference for the averages of the times for the two medications.
Solution:
We will use the
Large Sample Test for the Difference
BetweenTwo PopulationMeans
workbook to help with the computations.
By using this workbook, we will avoid all the computations. Also, we will
enter these values into the portion of the workbookwhere data are used to
perform the test. Since the standard deviations for the two populations of
times are unknown and the sampling distributions are unknown, we will
have to use the results in that section.
Figure 12-33
shows the appropriate output from the workbook. Since we
are testing to determine whether there was a difference, then we will have to
use the results for a two-tailed test. Observe that the
P
-value is equal to
0.6598 for the two-tailed test so we can use the
P
-value approach to test the
hypothesis.