


 579 / 762

Chapter 12: Hypothesis Tests – Large Samples
579
We used the
P-
value to measure the strength of the evidence against the null
hypothesis for that test. The smaller the
P-
value, the stronger will be the
evidence against the null hypothesis. That is, the smaller the
P-
value, the
stronger is the evidence that we should reject the null hypothesis in favor of
the alternative hypothesis.
We may further fine tune the range of the
P
-values to quantify the strength
of the evidence against the null hypothesis.
Typical, or a
Rule-of-Thumb
cutoff points, are given next.
P-
value > 0.1
little evidence against
0.05 <
P-
value
0.1
some evidence against
0.01 <
P-
value
0.05
moderate evidence against
0.001
<
P-
value
0.01
strong evidence against
P-
value
0.001
very strong evidence against
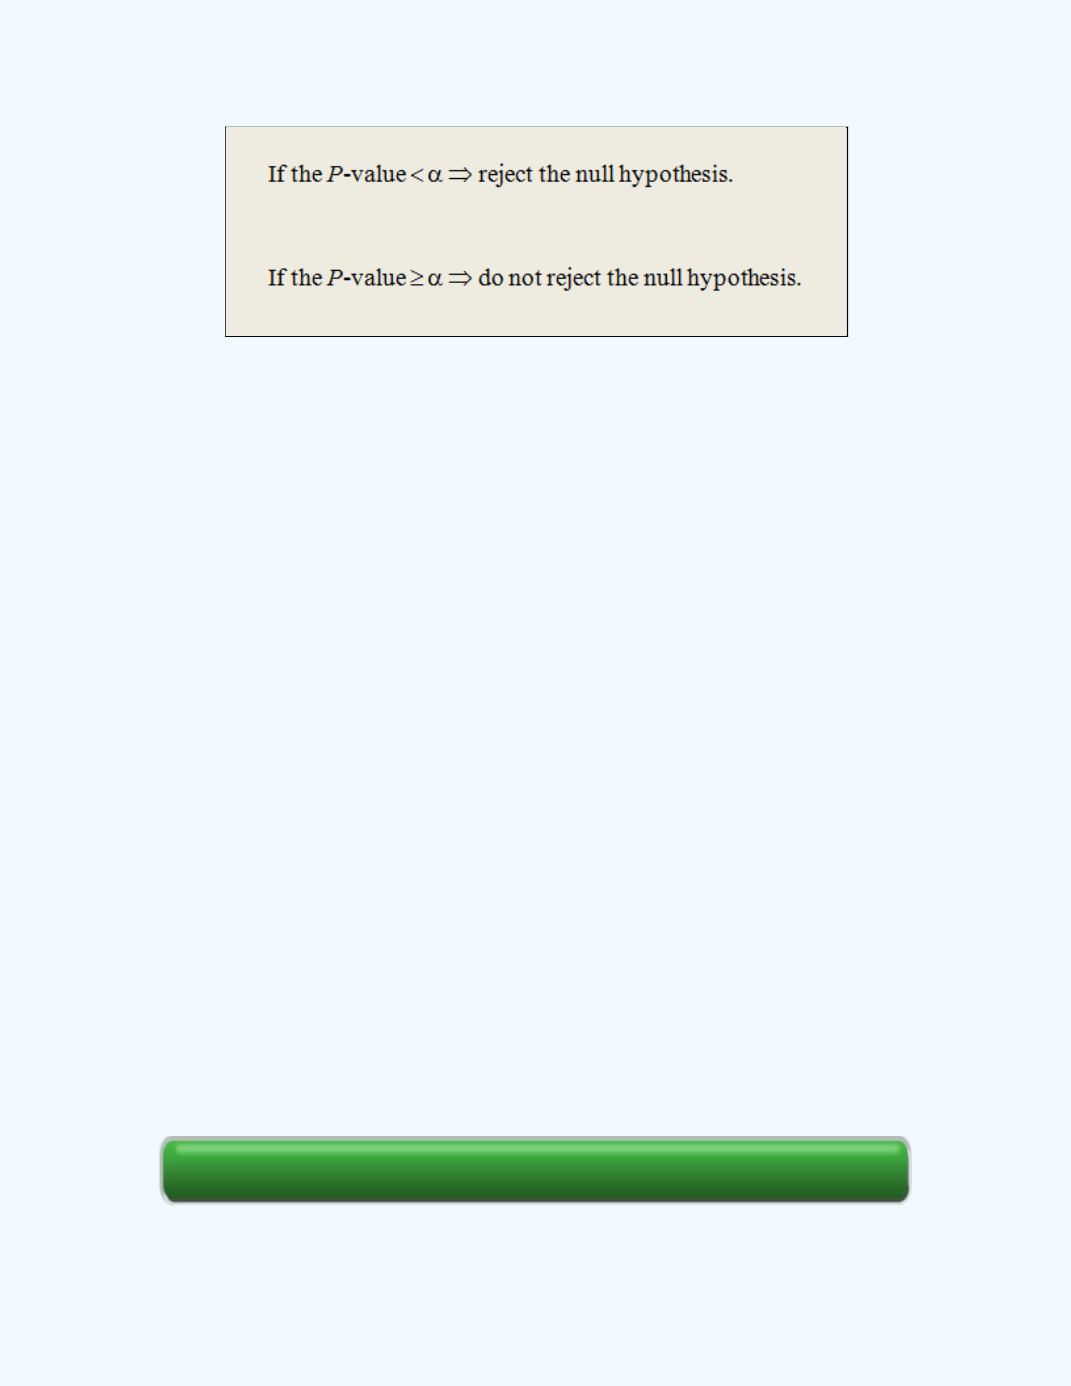
Using the above guide to make a decision, for
Examples 12.13
, we will
reject the null hypothesis since the
P-
value = 0.0097 which is smaller than
the significance level
= 5% = 0.05. Based on the Rule-of-Thumb, a
P
-value of 0.0097, would suggest that the evidence against the null
hypothesis is moderate
Section Review
e-Self Review